
Page 45 - IJB-2-2
P. 45
Behnam Taidi, Guillaume Lebernede, Lothar Koch, et al.
Day 1 Day 3 Day 6
Day 8 Day 9 Day 10
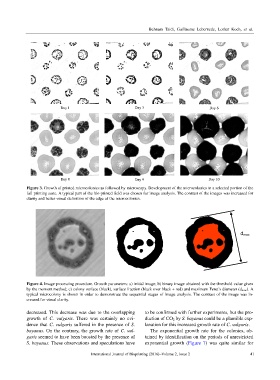
Figure 3. Growth of printed microcolonies as followed by microscopy. Development of the microcolonies in a selected portion of the
full printing zone. A typical part of the bio-printed field was chosen for image analysis. The contrast of the images was increased for
clarity and better visual definition of the edge of the microcolonies.
d max
Figure 4. Image processing procedure. Growth parameters: a) initial image; b) binary image obtained with the threshold value given
by the moment method; c) colony surface (black), surface fraction (black over black + red) and maximum Feret’s diameter (d max ). A
typical microcolony is shown in order to demonstrate the sequential stages of image analysis. The contrast of the image was in-
creased for visual clarity.
decreased. This decrease was due to the overlapping to be confirmed with further experiments, but the pro-
growth of C. vulgaris. There was certainly no evi- duction of CO 2 by S. bayanus could be a plausible exp-
dence that C. vulgaris suffered in the presence of S. lanation for this increased growth rate of C. vulgaris.
bayanus. On the contrary, the growth rate of C. vul- The exponential growth rate for the colonies, ob-
garis seemed to have been boosted by the presence of tained by identification on the periods of unrestricted
S. bayanus. These observations and speculations have exponential growth (Figure 7) was quite similar for
International Journal of Bioprinting (2016)–Volume 2, Issue 2 41