
Page 93 - IJB-2-2
P. 93
Weiguang Wang, Guilherme Ferreira Caetano, Wei-Hung Chiang, et al.
(0.001% in culture medium) was added to each well. the onset of thermal degradation due to the presence
The plates were incubated for 4 hours under standard of pristine graphene. Results also indicate that no
conditions. After incubation, 100 µL of each sample degradation events occur during the scaffold fabrica-
o
was transferred to a 96-well plate and the fluorescence tion process, since the extrusion temperature was 90 C.
intensity was measured at 540 nm excitation wave-
length and 590 nm emission wavelength with a spec- 3.2 Morphological Analysis
trophotometer (Sunrise; Tecan, Männedorf, Zurich, Figures 2 and 3 show the SEM micrographs (top and
Switzerland). Experiments were performed at least cross-section) of PCL and PCL/pristine graphene sca-
three times in duplicate. ffolds. From the top view of these micrographs
(Figure 2), it is possible to observe that scaffolds pre-
Cell Morphology sent a well-defined internal geometry and uniform
After incubation for 14 days, cell-seeded scaffolds pore distribution. Cross-section micrographs (Figure 3)
were observed with SEM to assess the cell attachment show a good adhesion between adjacent layers. The
and morphology. Scaffold samples were fixed with 2% values of pore size and filament width are summarised
glutaraldehyde solution (Sigma-Aldrich, UK) for 2 in Table 3. Results show an increase in the filament
hours at room temperature. Then scaffolds were rinsed width due to the increase in pristine graphene, result-
twice with PBS, dehydrated with graded ethanol series, ing in a slight decrease in both pore size and porosity.
following 50%, 70%, 80%, 90% and 100%, then 50:50 Figure 4 shows the corresponding variation trends.
ethanol:hexamethyldisilazane (v/v) (HMDS) and 100%
HMDS (with 10 minutes exposure steps), and then air 3.3 Mechanical Compression Test
dried for removal of HMDS [35] . Samples were coated The mechanical behaviour of the scaffolds is strongly
with platinum and imaged using SEM, as described correlated to the amount of pristine graphene in PCL.
above. Results show that by increasing the concentration of
pristine graphene from 0.13% to 0.78%, the compres-
2.8 Data Analysis sion modulus increased from 80 MPa to circa 130
All data were represented as mean ± standard devia- MPa (Table 4 and Figure 5). This effect is due not
tion. Biological results were subjected to one-way only to the reinforcement effect of the pristine gra-
analysis of variance (one-way ANOVA) and Tukey’s phene but also to the differences in terms of pore size
post-hoc test using GraphPad Prism software. Signifi- (Table 3). In comparison to PCL scaffolds, a slight
cance levels were set at p < 0.05. decrease in mechanical properties was observed for
scaffolds containing 0.13% pristine graphene, which
3. Results and Discussion the authors hypothesise, could be due to the stress
concentration in the interface between the polymer
3.1 Thermogravimetric Analysis and the pristine graphene, which superpose the rein-
The final content of pristine graphene in the PCL/pri- forcement effect of pristine graphene and the reduc-
stine graphene composite scaffolds was calculated by tion on the pore size. Maximum values of compres-
TGA. The results (Table 2) suggest that the pristine sion modulus observed for scaffolds containing higher
concentrations of pristine graphene are in the mid range
graphene was effectively incorporated into the com- of properties reported for human trabecular bone [36] .
posite scaffolds, without significant losses during the
melt blending process. It is also possible to observe 3.4 Apparent Water-in-air Contact Angle Analysis
from Table 2 that there is no significant difference on
To access the hydrophilicity, the static contact angle
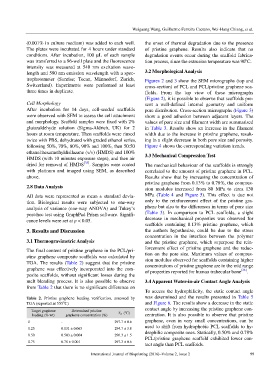
Table 2. Pristine graphene loading verification, assessed by was determined and the results presented in Table 5
o
TGA (reported at 555 C) and Figure 6. The results show a decrease in the static
contact angle by increasing the pristine graphene con-
Target graphene Determined pristine o
loading (% wt) graphene concentration (%) T d ( C) centration. It is also possible to observe that pristine
0 - 297.7 ± 0.6 graphene, even in very small concentrations, can be
used to shift from hydrophobic PCL scaffolds to hy-
0.25 0.131 ± 0.065 294.7 ± 3.8
0.50 0.503 ± 0.004 296.3 ± 1.5 drophilic composite ones. Statically, 0.50% and 0.78%
PCL/pristine graphene scaffold exhibited lower con-
0.75 0.78 ± 0.001 297.3 ± 0.6
tact angle than PCL scaffolds.
International Journal of Bioprinting (2016)–Volume 2, Issue 2 99