
Page 95 - IJB-2-2
P. 95
Weiguang Wang, Guilherme Ferreira Caetano, Wei-Hung Chiang, et al.
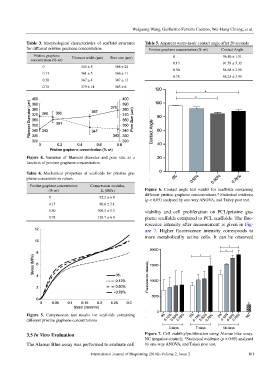
Table 3. Morphological characteristics of scaffold structures Table 5. Apparent water-in-air contact angle after 20 seconds
for different pristine graphene concentration Pristine graphene concentration (% wt) Contact Angle
Pristine graphene Filament width (μm) Pore size (μm) 0 96.10 ± 1.51
concentration (% wt)
0.13 91.78 ± 5.32
0 343 ± 5 368 ± 24
0.50 84.68 ± 2.98
0.13 361 ± 5 366 ± 11
0.78 88.25 ± 3.95
0.50 367 ± 4 347 ± 13
0.78 379 ± 14 343 ± 6
Figure 4. Variation of filament diameter and pore size as a
function of pristine graphene concentration.
Table 4. Mechanical properties of scaffolds for pristine gra-
phene concentration values
Pristine graphene concentration Compression modulus,
(% wt) E c [MPa] Figure 6. Contact angle test results for scaffolds containing
different pristine graphene concentrations.* Statistical evidence
0 82.2 ± 6.8
(p < 0.05) analysed by one-way ANOVA, and Tukey post test.
0.13 80.6 ± 3.1
0.50 109.3 ± 5.3 viability and cell proliferation on PCL/pristine gra-
0.78 128.7 ± 6.9 phene scaffolds compared to PCL scaffolds. The fluo-
rescence intensity after measurement is given in Fig-
ure 7. Higher fluorescence intensity corresponds to
more metabolically active cells. It can be observed
Figure 5. Compression test results for scaffolds containing
different pristine graphene concentrations.
3.5 In Vitro Evaluation Figure 7. Cell viability/proliferation using Alamar blue assay.
NC (negative control); *Statistical evidence (p < 0.05) analysed
The Alamar Blue assay was performed to evaluate cell by one-way ANOVA, and Tukey post test.
International Journal of Bioprinting (2016)–Volume 2, Issue 2 101