
Page 63 - IJB-3-1
P. 63
3D bioprinting of stem cells and polymer/bioactive glass composite scaffolds for bone tissue engineering
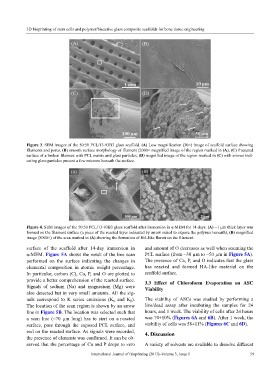
Figure 3. SEM images of the 50:50 PCL/13-93B3 glass scaffold. (A) Low magnification (30×) image of scaffold surface showing
filaments and pores, (B) smooth surface morphology of filament (2000× magnified image of the region marked in (A), (C) fractured
surface of a broken filament with PCL matrix and glass particles, (D) magnified image of the region marked in (C) with arrows indi-
cating glass particles present a few microns beneath the surface.
Figure 4. SEM images of the 50:50 PCL/13-93B3 glass scaffold after immersion in α-MEM for 14 days. (A) ~1 µm thick layer was
formed on the filament surface (a piece of the reacted layer indicated by arrow raised to expose the polymer beneath), (B) magnified
image (8000×) of the area marked in (A) showing the formation of HA-like florets on the filament.
surface of the scaffold after 14-day immersion in and amount of O decreases as well when scanning the
α-MEM. Figure 5A shows the result of the line scan PCL surface (from ~30 µm to ~50 µm in Figure 5A).
performed on the surface indicating the changes in The presence of Ca, P, and O indicates that the glass
elemental composition in atomic weight percentage. has reacted and formed HA-like material on the
In particular, carbon (C), Ca, P, and O are plotted to scaffold surface.
provide a better comprehension of the reacted surface. 3.3 Effect of Chloroform Evaporation on ASC
Signals of sodium (Na) and magnesium (Mg) were Viability
also detected but in very small amounts. All the sig-
nals correspond to K series emissions (K α and K β). The viability of ASCs was studied by performing a
The location of the scan region is shown by an arrow live/dead assay after incubating the samples for 24
line in Figure 5B. The location was selected such that hours, and 1 week. The viability of cells after 24 hours
a scan line (~70 µm long) has to start on a r eacted was 70±10% (Figures 6A and 6B). After 1 week, the
surface, pass through the exposed PCL surface, and viability of cells was 58±11% (Figures 6C and 6D).
end on the reacted surface. As signals were recorded, 4. Discussion
the presence of elements was confirmed. It can be ob-
served that the percentage of Ca and P drops to zero A variety of solvents are available to dissolve different
International Journal of Bioprinting (2017)–Volume 3, Issue 1 59