
Page 100 - IJB-10-3
P. 100
International Journal of Bioprinting 3D bioprinting for vascularized skin tissue engineering
be sufficient for vascularization owing to the adequate shown in Figure 3A. 38,39,41,42,44,46-53 Non-hypoxic and hypoxic
capillary proximity, which allows proper nutrition, gas groups have been developed using gelatin-based hydrogels
exchange, and metabolite diffusion. The transplantation for better understanding in vivo cluster-based angiogenesis
of large tissue constructs can be dangerous because of the mechanisms, including EPC functions. Hypoxic hydrogels
risk of ischemia during implantation. 38,39,41-45 The effective allowed EPCs and endothelial colony-forming cells
growth and support of implanted tissue require a sufficient (ECFCs) to proliferate and stabilize, whereas non-hypoxic
supply of nutrients and oxygen, as well as the removal of hydrogels prevented the formation of clusters. The GFP-
waste products through blood vessels. Cells and tissues in ECFCs that were injected intravenously showed significant
close proximity to capillaries or within a distance of 100– function. The in vivo oxygen levels were regulated by
200 µm are required for long-term growth and support, as incorporating calcium hydroxide along with calcium
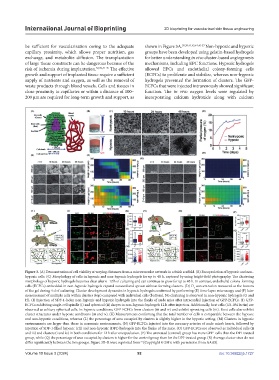
Figure 3. (A) Demonstration of cell viability at varying distances from a microvascular network in a thick scaffold. (B) Encapsulation of hypoxic and non-
hypoxic cells. (C) Morphology of cells in hypoxic and non-hypoxic hydrogels for up to 48 h, captured by using bright-field photography. The clustering
morphology of hypoxic hydrogels becomes clear after 6–12 h of culturing and can continue to grow for up to 48 h. In contrast, endothelial colony-forming
cells (ECFCs) embedded in non-hypoxic hydrogels expand outward and sprout without forming clusters. (D) O concentration measured at the bottom
2
of the gel during 4 d of culturing. Cluster development dynamics in hypoxic hydrogels confirmed by performing (E) time-lapse microscopy and (F) later
measurement of multiple cells within clusters (top) compared with individual cells (bottom). No clustering is observed in non-hypoxic hydrogels (G and
H). (I) Injection of SDF-1-laden non-hypoxic and hypoxic hydrogels into the flanks of nude mice after intracardial injection of GFP-ECFCs. (J) GFP-
ECFCs exhibiting single-cell spindle (i) and spherical (ii) shapes in non-hypoxic hydrogels 12 h after injection. Additionally, host cells (GS-IB4 lectin) are
observed as solitary spherical cells. In hypoxic conditions, GFP-ECFCs form clusters (iii and iv) and exhibit sprouting cells (iii). Host cells also exhibit
cluster structures under hypoxic conditions (iii and iv). (K) Measurements confirming that the total number of cells is comparable between the hypoxic
and non-hypoxic conditions, whereas (L) the percentage of area occupied by clusters is slightly higher in the hypoxic setting. (M) Clusters in hypoxic
environments are larger than those in normoxic environments. (N) GFP-ECFCs injected into the coronary arteries of nude mice’s hearts, followed by
injection of SDF-1-filled hypoxic (ctl) and non-hypoxic (DPI) hydrogels into the flanks of the mice. (O) GFP-ECFCs are observed as individual cells (ii
and iii) and clusters (i and iv) in both conditions for 12 h after encapsulation. (P) The untreated (control) group has more GFP cells than the DPI-treated
+
group, while (Q) the percentage of area occupied by clusters is higher for the control group than for the DPI-treated group. (R) Average cluster sizes do not
differ significantly between the two groups. Figure 3B–R were reprinted from (Copyright © 2019, with permission from AAAS).
54
Volume 10 Issue 3 (2024) 92 doi: 10.36922/ijb.1727