
Page 279 - IJB-10-3
P. 279
International Journal of Bioprinting 3D bioscaffolds with SR1 for vasculogenesis
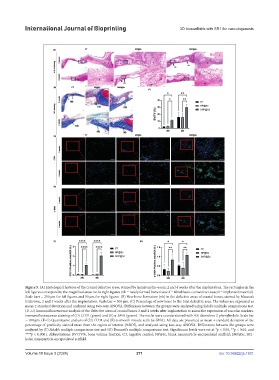
Figure 5. (A) Histological features of the cranial defective areas, stained by hematoxylin–eosin, 2 and 4 weeks after the implantation. The rectangles in the
left figures correspond to the magnified areas in the right figures (nb = newly formed bone tissue; f = fibroblastic connective tissue; I = implanted material).
Scale bars = 250 µm for left figures and 50 µm for right figures. (B) New bone formation (nb) in the defective areas of cranial bones, stained by Masson’s
trichrome, 2 and 4 weeks after the implantation. Scale bar = 100 µm. (C) Percentage of new bone to the total defective area. The values are expressed as
mean ± standard deviation and analyzed using two-way ANOVA. Differences between the groups were analyzed using Sidak’s multiple comparisons test.
(D–G) Immunofluorescence analysis of the defective areas of cranial bones 2 and 4 weeks after implantation to assess the expression of vascular markers.
Immunofluorescence staining of (D) CD31 (green) and (E) α-SMA (green). The nuclei were counterstained with 4’,6-dianidino-2-phenylindole. Scale bar
= 100 µm. (F–G) Quantitative analysis of (D) CD31 and (E) α-smooth muscle actin (α-SMA). All data are presented as mean ± standard deviation of the
percentage of positively stained areas from the region of interest (%ROI), and analyzed using two-way ANOVA. Differences between the groups were
analyzed by (F) Sidak’s multiple comparisons test and (G) Dunnett’s multiple comparisons test. Significance levels were set at *p < 0.05, **p < 0.01, and
****p < 0.0001. Abbreviations: BV/TV%, bone volume fraction; CT, negative control; NP@Sc, blank nanoparticle-encapsulated scaffold; SNP@Sc, SR1-
laden nanoparticle-encapsulated scaffold.
Volume 10 Issue 3 (2024) 271 doi: 10.36922/ijb.1931