
Page 336 - IJB-10-3
P. 336
International Journal of Bioprinting Acoustic analysis of 3D-printed ossicles
hardness, with an average hardness value of 406 HV, while SLM TC4 sample block has an average density of 4.416 g/
stainless steel 316L and HA/PCL have average hardness cm , which is 97.91% of the theoretical value of 4.51 g/cm .
3
3
values of 246 HV and 107 HV, respectively. The SLM 316L sample block has an average density of 7.819
3
3
Notably, the average hardness values of titanium alloy g/cm , which is 97.98% of the theoretical value of 7.98 g/cm .
TC4 and stainless steel 316L produced via laser selective However, both samples have slightly lower average densities
melting are significantly higher compared with those compared with those produced by traditional methods due
produced through traditional manufacturing methods. to instability during printing, which leads to incomplete
This can be attributed to the presence of dislocation melting of the powder on the surface. Defects were observed
structures embedded in coarse grains, resulting in a higher under the metallographic microscope after polishing. The
3
dislocation density than in traditionally manufactured density of HA is 3.076 g/cm , and PCL has a density of 1.146
3
materials. Consequently, the strength of the materials g/cm . When combined in the HA/PCL composite, the
3
increases, leading to a 5% and 8% increase in hardness for density is 1.26 g/cm . These values indicate the influence of
titanium alloy TC4 and stainless steel 316L, respectively. material composition on the final density of the composite.
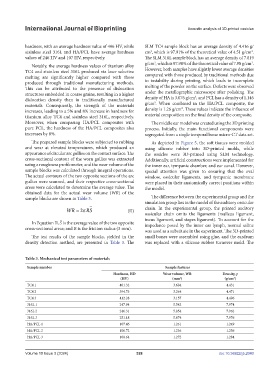
Moreover, when comparing HA/PCL composites with The middle ear model was created using the 3D printing
pure PCL, the hardness of the HA/PCL composites also process. Initially, the main functional components were
increases by 8%. segregated from a single temporal bone micro-CT data set.
The prepared sample blocks were subjected to rubbing As depicted in Figure 5, the soft tissues were molded
and wear at elevated temperatures, which produced an using silicone rubber into 3D-printed molds, while
appearance of circular arc gullies on the contact surface. The the ossicles were 3D-printed using SLM technology.
cross-sectional contour of the worn gullies was extracted Additionally, artificial constructions were implemented for
using a roughness profilometer, and the wear volume of the the inner ear, tympanic chamber, and ear canal. However,
sample blocks was calculated through integral operations. special attention was given to ensuring that the oval
The actual contours of the two opposite sections of the arc window, ossicular ligaments, and tympanic membrane
gullies were scanned, and their respective cross-sectional were placed in their anatomically correct positions within
areas were calculated to determine the average value. The the model.
obtained data for the actual wear volume (WR) of the
sample blocks are shown in Table 3. The difference between the experimental group and the
simulation group lies in the model of the auditory ossicular
WR = 2π RS (II) chain. In the experimental group, the printed auditory
ossicular chain omits the ligaments (malleus ligament,
– incus ligament, and stapes ligament). To account for the
In Equation II, S is the average value of the two opposite impedance posed by the inner ear lymph, normal saline
cross-sectional areas; and R is the friction radius (3 mm). was used as a substitute in the experiment. The 3D-printed
The test results of the sample blocks, yielded in the small bones were assembled using glue, and the eardrum
density detection method, are presented in Table 3. The was replaced with a silicone rubber turnover mold. The
Table 3. Mechanical test parameters of materials
Sample number Sample features
Hardness, HD Wear volume, WR Density, p
(HV) (mm ) (g/cm )
3
3
TC4 1 401.32 3.684 4.431
TC4 2 394.73 3.264 4.471
TC4 3 412.28 3.157 4.496
316L 1 247.94 5.542 7.974
316L 2 246.31 5.854 7.962
316L 3 251.18 5.674 7.976
HA/PCL 1 107.46 1.261 1.249
HA/PCL 2 106.72 1.236 1.256
HA/PCL 3 108.64 1.272 1.284
Volume 10 Issue 3 (2024) 328 doi: 10.36922/ijb.2040