
Page 343 - IJB-10-3
P. 343
International Journal of Bioprinting Acoustic analysis of 3D-printed ossicles
The hearing changes range from -4.6 dB to 1.39 dB. In cm to 7.82 g/cm , and the mass increases to 3.0, 4.4, and
3
3
the frequency range of 1–4 kHz, the ESP curve of TTH 2.1 times the normal values, respectively. Additionally,
shows a notched trend followed by a gradual slope. At 1.5 the elastic modulus changes from 14.1 GPa to 172.9 GPa,
kHz, the hearing decreases by 1.38 dB. In the 2–4 kHz which is equivalent to 12.2 times that of a normal human
range, the average hearing gain is 0.52 dB. On the other ear. However, the Poisson’s ratio remains unchanged.
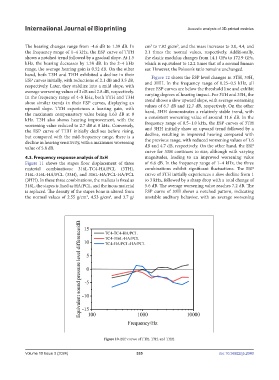
hand, both T3H and THH exhibited a decline in their Figure 12 shows the ESP level changes in 3TH, 33H,
ESP curves initially, with reductions of 2.1 dB and 3.5 dB, and 3HH. In the frequency range of 0.25–0.5 kHz, all
respectively. Later, they stabilize into a mild slope, with three ESP curves are below the threshold line and exhibit
average worsening values of 3 dB and 2.8 dB, respectively. varying degrees of hearing impact. For 3TH and 33H, the
In the frequency range of 4–8 kHz, both TTH and T3H trend shows a slow upward slope, with average worsening
show similar trends in their ESP curves, displaying an values of 6.7 dB and 12.7 dB, respectively. On the other
upward slope. TTH experiences a hearing gain, with hand, 3HH demonstrates a relatively stable trend, with
the maximum compensatory value being 1.63 dB at 8 a consistent worsening value of around 11.6 dB. In the
kHz. T3H also shows hearing improvement, with the
worsening value reduced to 2.7 dB at 8 kHz. Conversely, frequency range of 0.5–1.0 kHz, the ESP curves of 3TH
the ESP curve of THH initially declines before rising, and 3HH initially show an upward trend followed by a
but compared with the mid-frequency range, there is a decline, resulting in improved hearing compared with
decline in hearing sensitivity, with a maximum worsening the previous range, with reduced worsening values of 1.6
value of 5.8 dB. dB and 4.7 dB, respectively. On the other hand, the ESP
curve for 33H continues to rise, although with varying
4.3. Frequency response analysis of 3xH magnitudes, leading to an improved worsening value
Figure 11 shows the stapes floor displacement of three of 6.6 dB. In the frequency range of 1–4 kHz, the three
material combinations: 316L-TC4-HA/PCL (3TH), combinations exhibit significant fluctuations. The ESP
316L-316L-HA/PCL (33H), and 316L-HA/PCL-HA/PCL curve of 3TH initially experiences a slow decline from 1
(3HH). In these three combinations, the malleus is fixed as to 3 kHz, followed by a sharp drop with a total change of
316L, the stapes is fixed as HA/PCL, and the incus material 5.6 dB. The average worsening value reaches 7.2 dB. The
is replaced. The density of the stapes bone is altered from ESP curve of 33H shows a notched pattern, indicating
the normal values of 2.55 g/cm , 4.53 g/cm , and 3.7 g/ unstable auditory behavior, with an average worsening
3
3
Figure 10. ESP curves of TTH, T3H, and THH.
Volume 10 Issue 3 (2024) 335 doi: 10.36922/ijb.2040