
Page 344 - IJB-10-3
P. 344
International Journal of Bioprinting Acoustic analysis of 3D-printed ossicles
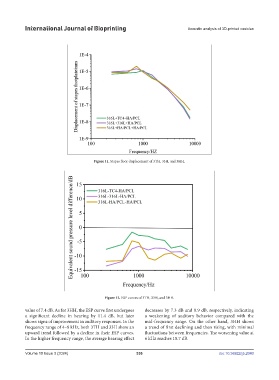
Figure 11. Stapes floor displacement of 3TH, 33H, and 3HH.
Figure 12. ESP curves of 3TH, 33H, and 3HH.
value of 7.4 dB. As for 3HH, the ESP curve first undergoes decreases by 7.3 dB and 8.9 dB, respectively, indicating
a significant decline in hearing by 11.4 dB, but later a weakening of auditory behavior compared with the
shows signs of improvement in auditory responses. In the mid-frequency range. On the other hand, 3HH shows
frequency range of 4–8 kHz, both 3TH and 33H show an a trend of first declining and then rising, with minimal
upward trend followed by a decline in their ESP curves. fluctuations between frequencies. The worsening value at
In the higher frequency range, the average hearing effect 6 kHz reaches 10.7 dB.
Volume 10 Issue 3 (2024) 336 doi: 10.36922/ijb.2040