
Page 342 - IJB-10-3
P. 342
International Journal of Bioprinting Acoustic analysis of 3D-printed ossicles
Table 5. Electrochemical parameters range of 0.25–0.50 kHz, all three combinations exhibit a
gradual upward trend in the ESP curves. The T3H has
Sample E corr (V) I corr (A/cm ) slightly higher ESP curve values compared with TTH and
2
316L -0.355 5.61E-04 THH. However, all three combinations are in a state of
TC4 -0.568 6.15E-04 hearing impairment. The maximum deterioration values
occur at 0.25 kHz, with respective values of 2.36 dB, 3.1
14.1 GPa to 110.4 GPa. When the incus part was 316L, the dB, and 6.6 dB. As the frequency increases, the degree
masses of the three parts were 3.42, 1.57, and 3.53 times of hearing impairment decreases. In the frequency range
the normal value, respectively, and the elastic modulus of 0.5–1.0 kHz, the ESP curve of TTH shows a gradual
increased from 14.1 GPa to 172.9 GPa. When the incus upward trend, and the hearing progressively improves.
part was HA/PCL, the masses of the three parts were 0.53, Around 1 kHz, the hearing returns to normal levels.
0.25, and 0.56 times the normal value, respectively, and the As for T3H, the ESP curve initially exhibits an upward
elastic modulus decreased from 14.1 GPa to 769.2 MPa. trend followed by a decline, with a minimum worsening
value of 0.64 dB at 0.75 kHz. On the other hand, THH
Figure 10 shows the equivalent sound pressure (ESP) shows significant fluctuations in the ESP curve, first
level changes in TTH, T3H, and THH. In the frequency demonstrating a sharp rise and then a slight decrease.
Table 6. Tensile test data
Number Tensile strength (MPa) Yield strength (MPa) Elongation at break (%) Elastic modulus (Ma)
TC4 1 997 946 15.7 107.4 × 10 6
TC4 2 987 937 14.6 108.2 × 10 6
TC4 3 981 928 14.3 106.9 × 10 6
316L 1 681 528 46.3 182.7 × 10 6
316L 2 677 534 47.2 176.5 × 10 6
316L 3 674 532 46.8 181.6 × 10 6
HA/PCL 1 18.96 17.67 13.12 58.06
HA/PCL 2 18.47 16.94 12.29 60.23
HA/PCL 3 18.16 17.52 11.96 59.68
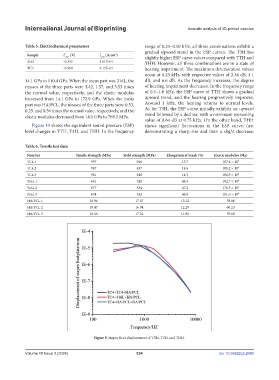
Figure 9. Stapes floor displacement of TTH, T3H, and THH.
Volume 10 Issue 3 (2024) 334 doi: 10.36922/ijb.2040