
Page 429 - IJB-10-3
P. 429
International Journal of Bioprinting Expanding 3D cell proliferation with DLP bioprinting
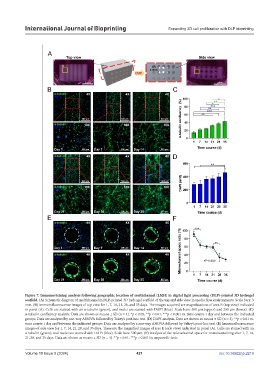
Figure 7. Immunostaining analysis following geographic location of multichannel (LMH) in digital light processing (DLP)-printed 3D hydrogel
scaffold. (A) Schematic diagram of multichannel in DLP-printed 3D hydrogel scaffold of the top and side view in media flow environments. Scale bars: 3
mm. (B) Immunofluorescence images of top view for 1, 7, 14, 21, 28, and 35 days. The images acquired are magnifications of area B (top view) indicated
in panel (A). Cells are stained with an α-tubulin (green), and nuclei are stained with DAPI (blue). Scale bars: 500 µm (upper) and 200 µm (lower). (C)
α-tubulin confluency analysis. Data are shown as means ± SD (n = 4). *p < 0.05, **p < 0.01, ***p < 0.001 vs. time course 1 day and between the indicated
groups. Data are analyzed by one-way ANOVA followed by Tukey’s post-hoc test. (D) DAPI analysis. Data are shown as means ± SD (n = 3). **p < 0.01 vs.
time course 1 day and between the indicated groups. Data are analyzed by a one-way ANOVA followed by Tukey’s post-hoc test. (E) Immunofluorescence
images of side view for 1, 7, 14, 21, 28, and 35 days. These are the magnified images of area E (side view) indicated in panel (A). Cells are stained with an
α-tubulin (green), and nuclei are stained with DAPI (blue). Scale bars: 500 µm. (F) Analysis of the microchannel space for immunostaining after 1, 7, 14,
21, 28, and 35 days. Data are shown as means ± SD (n = 4). **p < 0.01, ***p < 0.001 by unpaired t-tests.
Volume 10 Issue 3 (2024) 421 doi: 10.36922/ijb.2219