
Page 550 - IJB-10-3
P. 550
International Journal of Bioprinting Engineered 3D-printed PVA vascular grafts
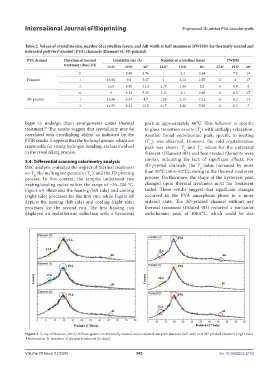
Table 2. Values of crystallite size, number of crystalline layers, and full width at half maximum (FWHM) for thermally treated and
untreated polyvinyl alcohol (PVA) channels (filament vs. 3D-printed)
PVA channel Duration of thermal Crystallite size (Å) Number of crystalline layers FWHM
treatment (days [D]) 12.6 o 19.6 o 46 o 12.6 o 19.6 o 46 o 12.6 o 19.6 o 46 o
0 - 9.49 4.76 - 2.1 2.44 - 7.5 19
Filament 1 13.93 9.6 5.17 2 2.13 2.55 6 6 17
3 16.5 8.45 11.3 2.35 1.89 5.2 5 6.8 8
0 9 9.33 5.39 1.33 2.1 2.69 6 6.5 17
3D-printed 1 13.58 9.37 4.7 1.88 2.13 2.21 6 6.2 13
3 14.79 9.22 12.5 2.17 2.06 5.95 6 6.3 7
begin to undergo chain arrangements under thermal peak at approximately 40℃. This behavior is specific
treatment. The results suggest that crystallinity may be to glass transition events (T ) with enthalpy relaxation.
63
g
correlated with crosslinking ability, as indicated by the Another broad endothermic peak, specific to melting
FTIR results. It appears that the hydroxyl groups, which are (T ), was observed. However, the cold crystallization
m
responsible for strong hydrogen bonding, are less involved peak was absent. T and T values for the untreated
g
m
in the crosslinking process. filament (Filament 0D) and heat-treated filaments were
3.4. Differential scanning calorimetry analysis similar, indicating the lack of significant effects. For
DSC analysis evaluated the impact of thermal treatment 3D-printed channels, the T value increased by more
g
on T , the melting temperature (T ), and the 3D printing than 20℃ (30.6–52℃), owing to the thermal treatment
m
g
process. In this context, the samples underwent two process. Furthermore, the shape of the hysteresis peak
heating/cooling cycles within the range of −20–200 °C. changed upon thermal treatment until the treatment
Figure 6A illustrates the heating (left side) and cooling ended. These results suggest that significant changes
(right side) processes for the first run, while Figure 6B occurred in the PVA amorphous phase in a more
depicts the heating (left side) and cooling (right side) ordered state. The 3D-printed channel without any
processes for the second run. The first heating run thermal treatment (Printed 0D) reported a particular
displayed an endothermic inflection with a hysteresis endothermic peak at 108.6℃, which could be due
Figure 5. X-ray diffraction (XRD) diffractograms for thermally treated and untreated samples: filament (left side) and 3D-printed channels (right side).
Abbreviation: D: duration of thermal treatment (in days).
Volume 10 Issue 3 (2024) 542 doi: 10.36922/ijb.2193