
Page 81 - IJB-5-2
P. 81
Arab W, et al.
as a marker for living cells and ethidium homodimer for fibrous structure of collagen in terms of architecture. The
dead cells. The bioprinted tissues were washed in PBS detailed assessment of CH-01 (Figure 2B) and CH-02
3 times and treated with calcein AM (green) and ethidium (Figure 2 C) showed that the fibrous structures of these
homodimer-1 (red) at 1:2 ratio in PBS. The samples were peptides resemble the fibrous structure of collagen in terms
then placed for 20 min in a dark incubator at 37°C and of architecture. This nanofibrous structure was produced
5% CO . After staining, they were washed again 3 times from the antiparallel pairing of two peptide monomers
2
in PBS. A confocal microscope (Leica SP8) was used for (Figure 1). Subsequently, the assembly of the peptide pairs
image acquisition. by stacking facilitated the formation of the fibers. The
hydrogel was formed by the condensation of these fibers.
2.6. Immunofluorescence Staining of
Differentiated Myoblasts 3.2. Cell Viability Results (MTT assay)
The differentiation of mouse myoblast cells within both After 24 h of incubation, cell proliferation was tested
hydrogels was studied in a glass confocal dish (12mm) by with different peptide concentrations to evaluate
immunofluorescence analysis. C2C12 (30,000 cells/plate) biocompatibility. The MTT assay was used to quantify
were embedded in different hydrogels. After 8 days of the number of viable cells. This was done by plotting a
differentiation, 4% paraformaldehyde solution was standard curve for a known number of cells (Figure 3B).
used for cells fixation. After 20 min incubation at room Test results indicated that the differences between both
temperature, the cells were permeabilized and labeled peptides CH-01 (Figure 3C), CH-02 (Figure 3D), and
with primary anti-MHC (1:300 PBS) for 1 h followed by positive control, Matrigel were non-significant, indicating
1 h incubation with secondary anti-mouse IgG-fluorescein that both scaffolds were suitable and biocompatible on
isothiocyanate and DAPI. The myotube formation was muscle myoblast cells.
observed with fluorescence confocal microscopy (Zeiss
LSM 710 Inverted Confocal Microscope, Germany). 3.3. Differentiation of Muscle Myoblasts
To confirm whether these scaffolds induce differentiation
2.7. Statistical Analysis of C2C12 myoblasts, the expression of MHC, which
All results are presented as a mean±standard deviation. is a late-stage differentiation marker of myogenesis,
Each type of test was repeated in three similar experiments. was observed through immunostaining. After inducing
Statistical differences among the experimental groups were differentiation of the cells in differentiation media for
determined with one-way analysis of variance. When P<0.05, 8 days, MHC expression was observed from myoblasts
the results were considered to be statistically significant. cultured on both scaffolds and was found to be similar
to the positive control Matrigel, as shown in Figure 4A.
3. Results These findings indicate that both scaffolds promote
muscle cell differentiation, thus suggesting that these
3.1. The Nanofibrous Morphology of Self- materials may prove to be beneficial in increasing muscle
assembling Peptides mass. The fusion index was calculated from MHC stained
cells, which is defined as the number of nuclei present
The nanofibrous morphology of the self-assembling in myotubes in comparison to the total number of nuclei
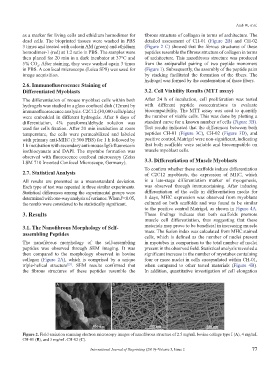
peptides was observed through SEM imaging. It was present in the observed field. Statistical analysis revealed a
then compared to the morphology observed in bovine significant increase in the number of myotubes containing
collagen (Figure 2A), which is comprised by a unique four or more nuclei in cells encapsulated within CH-01,
triple-helical structure . SEM results confirmed that when compared to other tested materials (Figure 4B).
[23]
the fibrous structures of these peptides resemble the In addition, quantitative investigation of cell elongation
A B C
Figure 2. Field emission scanning electron microscopy images of nanofibrous structure of 2.5 mg/mL bovine collage type I (A), 4 mg/mL
CH-01 (B), and 3 mg/mL CH-02 (C).
International Journal of Bioprinting (2019)–Volume 5, Issue 2 77