
Page 142 - IJB-10-5
P. 142
International Journal of Bioprinting Liver printing: from structure to application
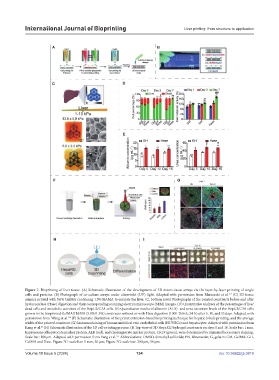
Figure 7. Bioprinting of liver tissue. (A) Schematic illustration of the development of 3D micro-tissue arrays via the layer-by-layer printing of single
151
cells and proteins. (B) Photograph of co-culture arrays under ultraviolet (UV) light. Adapted with permission from Matsusaki et al. (C) 3D tissue
mimics printed with 5.0% GelMA containing 1.5% HAMA to emulate the liver. (C, bottom rows) Photographs of the printed constructs before and after
hyaluronidase (Hase) digestion and their corresponding scanning electron microscope (SEM) images. (D) Quantitative analyses of the percentages of live/
dead cells and metabolic activities of the HepG2/C3A cells. (E) Quantitative results of albumin (ALB)- and urea-secretion levels of the HepG2/C3A cells
grown in the bioprinted GelMA/HAMA (5.0%/1.5%) constructs without or with Hase digestion (1000 U/mL; 24 h) after 5, 10, and 15 days. Adapted with
156
permission from Wang et al. (F) Schematic illustration of the preset extrusion-based bioprinting technique for hepatic lobule printing, and the average
width of the printed construct. (G) Immunostaining of human umbilical vein endothelial cells (HUVECs) and hepatocytes. Adapted with permission from
27
Kang et al. (H) Schematic illustration of the 3D cell-printing process. (I) Top view of 3D HepaRG/hydrogel constructs on days 0 and 10. Scale bar: 1 mm.
Expressions of hepatocyte marker protein, ALB (red), and cholangiocyte marker protein, CK19 (green), were determined by immunofluorescence staining.
161
Scale bar: 100 µm. Adapted with permission from Yang et al. Abbreviations: DMSO, dimethyl sulfoxide; FN, fibronectin; G, gelatin; GM, GelMA; GH,
GelMA and Hase. Figure 7C: scale bar: 1 mm, 50 μm; Figure 7G: scale bar: 200 μm, 50 μm.
Volume 10 Issue 5 (2024) 134 doi: 10.36922/ijb.3819