
Page 427 - IJB-10-5
P. 427
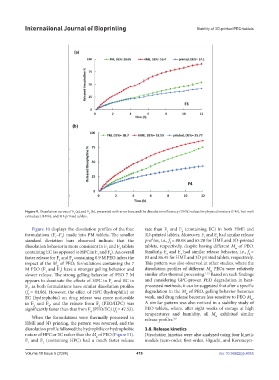
International Journal of Bioprinting                                     Stability of 3D-printed PEO tablets


            Figure 9. Dissolution curves of F (a) and F  (b), presented with error bars and the dissolution efficiency (DE%) values for physical mixture (PM), hot-melt
                                       4
                                 3
            extrudate (HME), and 3D-printed tablets.
               Figure 10 displays the dissolution profiles of the four   rate than F  and F  (containing EC) in both HME and
                                                                               4
                                                                        3
            formulations (F –F ) made into PM tablets. The smaller   3D-printed tablets. Moreover, F  and F  had similar release
                           4
                                                                                        1
                         1
                                                                                             2
            standard  deviation  bars  observed indicate that the   profiles, i.e., f = 88.08 and 65.28 for HME and 3D-printed
                                                                         2
            dissolution behavior is more consistent in F  and F  tablets   tablets, respectively, despite having different M  of PEO.
                                              3
                                                                                                     w
                                                    4
            containing EC (as opposed to HPC in F  and F ). An overall   Similarly, F  and F  had similar release behavior, i.e., f =
                                           1
                                                2
                                                                                                           2
                                                                              4
                                                                        3
            faster release for F  and F  containing 0.9 M PEO infers the   83 and 86.45 for HME and 3D printed tablets, respectively.
                          2
                                4
            impact of the M  of PEO; formulations containing the 7   This pattern was also observed in other studies, where the
                         w
            M PEO (F  and F ) have a stronger gelling behavior and   dissolution profiles of different  M  PEOs were relatively
                                                                                           w
                          3
                    1
            slower release. The strong gelling behavior of PEO 7 M   similar after thermal processing.  Based on such findings
                                                                                         1,13
            appears to dominate the effects of HPC in F  and EC in   and  considering  GPC-proven  PEO  degradation  in heat-
                                                1
            F , as both formulations have similar dissolution profiles   processed methods, it can be suggested that after a specific
             3
            (f = 84.86). However, the effect of HPC (hydrophilic) or   degradation in the M  of PEO, gelling behavior becomes
                                                                                w
             2
            EC (hydrophobic) on drug release was more noticeable   weak, and drug release becomes less sensitive to PEO M .
                                                                                                            w
            in F  and F , and the release from F  (PEO/HPC) was   A similar pattern was also noticed in a stability study of
                      4
                                           2
               2
            significantly faster than that from F  (PEO/EC) (f = 47.53).  PEO tablets, where, after eight weeks of storage at high
                                        4         2            temperatures and humidity, all  M  exhibited similar
               When the formulations were thermally processed in   release profiles. 8,9     w
            HME and 3D printing, the pattern was reversed, and the
            dissolution profile followed the hydrophilic or hydrophobic   3.8. Release kinetics
            nature of HPC or EC rather than the M  of PEO (Figure 11).    Dissolution kinetics were also analyzed using four kinetic
                                          w
            F   and  F   (containing  HPC)  had  a  much  faster  release   models (zero-order, first-order, Higuchi, and Korsmeyer-
             1
                   2
            Volume 10 Issue 5 (2024)                       419                                doi: 10.36922/ijb.4055