
Page 425 - IJB-10-5
P. 425
International Journal of Bioprinting Stability of 3D-printed PEO tablets
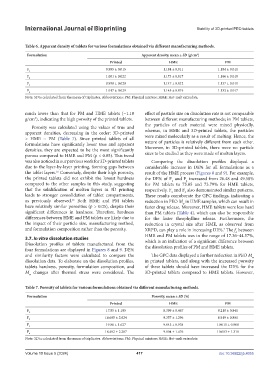
Table 6. Apparent density of tablets for various formulations obtained via different manufacturing methods.
Formulation Apparent density, mean ± SD (g/cm )
3
Printed HME PM
F 1 0.995 ± 0.015 1.184 ± 0.011 1.184 ± 0.011
F 2 1.001 ± 0.022 1.173 ± 0.017 1.166 ± 0.010
F 3 0.998 ± 0.020 1.147 ± 0.012 1.137 ± 0.011
F 4 1.017 ± 0.029 1.145 ± 0.019 1.133 ± 0.017
Note: SD is calculated from the mean of triplicates. Abbreviations: PM: Physical mixture; HME: Hot-melt extrudate.
much lower than that for PM and HME tablets (~1.18 effect of particle size on dissolution rate is not comparable
g/cm ), indicating the high porosity of the printed tablets. between different manufacturing methods; in PM tablets,
3
the particles of each material were mixed physically,
Porosity was calculated using the values of true and
apparent densities, decreasing in the order: 3D-printed whereas, in HME and 3D-printed tablets, the particles
> HME ~ PM (Table 7). Since printed tablets of all were mixed molecularly as a result of melting. Hence, the
formulations have significantly lower true and apparent nature of particles is relatively different from each other.
densities, they are expected to be the most significantly Moreover, in 3D-printed tablets, there were no particle
porous compared to HME and PM (p < 0.05). This trend sizes to be studied as they were made of molten layers.
was also noticed in our previous work for 3D-printed tablets Comparing the dissolution profiles displayed a
due to the layer-by-layer printing, forming gaps between considerable increase in DE% for all formulations as a
the tablet layers. Conversely, despite their high porosity, result of the HME process (Figures 8 and 9). For example,
16
the printed tablets did not exhibit the lowest hardness the DE% of F and F increased from 26.48 and 49.58%
1
2
compared to the other samples in this study, suggesting for PM tablets to 75.05 and 73.79% for HME tablets,
that the solidification of molten layers in 3D printing respectively. F and F also demonstrated similar patterns.
3
4
leads to stronger consolidation of tablet compartments, These results corroborate the GPC findings, indicating a
as previously observed. Both HME and PM tablets reduction in PEO M in HME samples, which can result in
16
w
have relatively similar porosities (p > 0.05), despite their faster drug release. Moreover, HME tablets were less hard
significant differences in hardness. Therefore, hardness than PM tablets (Table 4), which can also be responsible
differences between HME and PM tablets are likely due to for the faster theophylline release. Furthermore, the
the impact of their particle size, manufacturing method, reduction in crystal size after HME, as observed from
and formulation composition rather than the porosity. XRPD, can play a role in increasing DE%. The f between
7
2
HME and PM tablets was in the range of 17.36–44.57%,
3.7. In vitro dissolution studies which is an indication of a significant difference between
Dissolution profiles of tablets manufactured from the the dissolution profiles of PM and HME tablets.
four formulations are displayed in Figures 8 and 9. DE%
and similarity factors were calculated to compare the The GPC data displayed a further reduction in PEO M
w
dissolution data. To elaborate on the dissolution profiles, in printed tablets, and along with the increased porosity
tablets hardness, porosity, formulation composition, and of these tablets should have increased the DE% for the
M changes after thermal stress were considered. The 3D-printed tablets compared to HME tablets. However,
w
Table 7. Porosity of tablets for various formulations obtained via different manufacturing methods.
Formulation Porosity, mean ± SD (%)
Printed HME PM
F 17.85 ± 1.195 8.399 ± 0.467 8.218 ± 0.841
1
F 16.685 ± 2.624 9.357 ± 1.296 8.919 ± 0.801
2
F 19.80 ± 1.627 9.045 ± 0.938 10.015 ± 0.908
3
F 18.492 ± 2.287 9.804 ± 1.476 10.083 ± 1.318
4
Note: SD is calculated from the mean of triplicates. Abbreviations: PM: Physical mixture; HME: Hot-melt extrudate.
Volume 10 Issue 5 (2024) 417 doi: 10.36922/ijb.4055