
Page 424 - IJB-10-5
P. 424
International Journal of Bioprinting Stability of 3D-printed PEO tablets
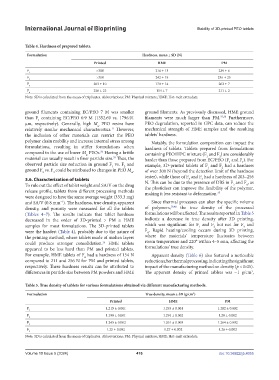
Table 4. Hardness of prepared tablets.
Formulation Hardness, mean ± SD (N)
Printed HME PM
F 1 >300 216 ± 13 239 ± 6
F >300 242 ± 19 236 ± 25
2
F 3 203 ± 10 170 ± 14 202 ± 7
F 256 ± 23 154 ± 7 211 ± 2
4
Note: SD is calculated from the mean of triplicates. Abbreviations: PM: Physical mixture; HME: Hot-melt extrudate.
ground filaments containing EC/PEO 7 M was smaller ground filaments. As previously discussed, HME ground
than F containing EC/PEO 0.9 M (1352.69 vs. 1796.91 filaments were much larger than PM. 37,38 Furthermore,
4
µm, respectively). Generally, high M PEO resins have PEO degradation, reported in GPC data, can reduce the
w
relatively similar mechanical characteristics. However, mechanical strength of HME samples and the resulting
11
the inclusion of other materials can restrict the PEO tablets’ hardness.
polymer chain mobility and increase internal stress among Notably, the formulation composition can impact the
formulations, resulting in stiffer formulations when hardness of tablets. Tablets prepared from formulations
36
compared to the use of lower M PEOs. Having a brittle containing PEO/HPC mixture (F and F ) are considerably
w
2
1
material can usually result in finer particle size. Thus, the harder than those prepared from EC/PEO (F and F ). For
33
3
4
observed particle size reduction in ground F vs. F and example, 3D-printed tablets of F and F had a hardness
2
1
1
2
ground F vs. F could be attributed to changes in PEO M . of over 300 N (beyond the detection limit of the hardness
3 4 w
tester), while those of F and F had a hardness of 203–256
3.6. Characterization of tablets N. This can be due to the presence of DBS in F and F , as
3
4
To rule out the effect of tablet weight and SA/V on the drug the plasticizer can improve the flexibility of the polymer,
4
3
release profile, tablets from different processing methods making it less resistant to deformation. 35
were designed to have the same average weight (333.3 mg)
and SA/V (0.8 mm ). The hardness, true density, apparent Since thermal processes can alter the specific volume
−1
density, and porosity were measured for all the tablets of polymers, 39,40 the true density of the processed
(Tables 4–7). The results indicate that tablet hardness formulations will be affected. The results reported in Table 5
decreased in the order of 3D-printed > PM ≥ HME indicate a decrease in true density after 3D printing,
samples for most formulations. The 3D-printed tablets which was significant for F and F but not for F and
1
3
2
were the hardest (Table 4), probably due to the nature of F . Rapid heating/cooling occurs during 3D printing,
4
the printing method, where tablets made of molten layers where the materials’ temperature fluctuates between
could produce stronger consolidation. HME tablets room temperature and 220° within 4–5 min, affecting the
16
appeared to be less hard than PM and printed tablets. formulations’ true density.
For example, HME tablets of F had a hardness of 154 N Apparent density (Table 6) also featured a noticeable
4
compared to 211 and 256 N for PM and printed tablets, reduction after thermal processing, indicating the significant
respectively. These hardness results can be attributed to impact of the manufacturing method on density (p < 0.05).
differences in particle size between PM powders and HME The apparent density of printed tablets was ~1 g/cm ,
3
Table 5. True density of tablets for various formulations obtained via different manufacturing methods.
Formulation True density, mean ± SD (g/cm )
3
Printed HME PM
F 1 1.215 ± 0.001 1.293 ± 0.001 1.282 ± 0.002
F 2 1.198 ± 0.001 1.294 ± 0.002 1.28 ± 0.002
F 3 1.245 ± 0.002 1.261 ± 0.003 1.264 ± 0.002
F 4 1.25 ± 0.002 1.27 ± 0.002 1.26 ± 0.002
Note: SD is calculated from the mean of triplicates. Abbreviations: PM: Physical mixture; HME: Hot-melt extrudate.
Volume 10 Issue 5 (2024) 416 doi: 10.36922/ijb.4055