
Page 422 - IJB-10-5
P. 422
International Journal of Bioprinting Stability of 3D-printed PEO tablets
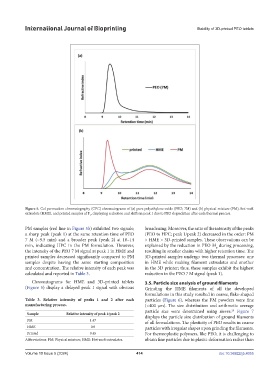
Figure 5. Gel permeation chromatography (GPC) chromatograms of (a) pure polyethylene oxide (PEO; 7M) and (b) physical mixture (PM), hot-melt
extrudate (HME), and printed samples of F , displaying reduction and shifts in peak 1 due to PEO degradation after each thermal process.
1
PM samples (red line in Figure 5b) exhibited two signals; broadening. Moreover, the ratio of the intensity of the peaks
a sharp peak (peak 1) at the same retention time of PEO (PEO to HPC; peak 1/peak 2) decreased in the order: PM
7 M (~9.5 min) and a broader peak (peak 2) at 10–14 > HME > 3D-printed samples. These observations can be
min, indicating HPC in the PM formulation. However, explained by the reduction in PEO M during processing,
w
the intensity of the PEO 7 M signal at peak 1 in HME and resulting in smaller chains with higher retention time. The
printed samples decreased significantly compared to PM 3D-printed samples undergo two thermal processes: one
samples despite having the same starting composition in HME while making filament extrudates and another
and concentration. The relative intensity of each peak was in the 3D printer; thus, these samples exhibit the highest
calculated and reported in Table 3. reduction in the PEO 7 M signal (peak 1).
Chromatograms for HME and 3D-printed tablets 3.5. Particle size analysis of ground filaments
(Figure 5) display a delayed peak 1 signal with obvious Grinding the HME filaments of all the developed
formulations in this study resulted in coarse, flake-shaped
Table 3. Relative intensity of peaks 1 and 2 after each particles (Figure 6), whereas the PM powders were fine
manufacturing process. (<400 µm). The size distribution and arithmetic average
particle size were determined using sieves. Figure 7
20
Sample Relative intensity of peak 1/peak 2 displays the particle size distribution of ground filaments
PM 1.47 of all formulations. The plasticity of PEO results in coarse
HME 0.9 particles with irregular shapes upon grinding the filaments.
Printed 0.45 For thermoplastic polymers, like PEO, it is challenging to
Abbreviations: PM: Physical mixture; HME: Hot-melt extrudates. obtain fine particles due to plastic deformation rather than
Volume 10 Issue 5 (2024) 414 doi: 10.36922/ijb.4055