
Page 62 - IJB-6-1
P. 62
Vascularization of printed bilayer skin grafts
was no significant difference in OD between blue were located on the top layer of the double-
the experimental and control groups, indicating layered skin-printed graft, and microvascular
that the extract had no inhibitory effect on cell endothelial cells and fibroblasts labeled red and
growth (P < 0.05). Relative growth rate (RGR) green, respectively, were evenly distributed on the
was calculated according to the measured OD bottom layer of a double layer skin graft. In vitro
value. The RGR was between 92.0% and 98.3%, culture and observation continued until 7 days
indicating that cytotoxicity was Grade 0 or 1, which after printing. It was observed that the double-
is conventionally considered as noncytotoxic. layer skin graft maintained normal skin structure,
with no apparent microangiogenesis observed,
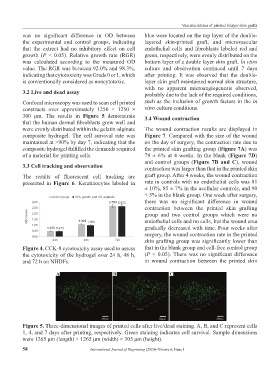
3.2 Live and dead assay probably due to the lack of the required conditions,
Confocal microscopy was used to scan cell printed such as the inclusion of growth factors in the in
constructs over approximately 1250 × 1250 × vitro culture conditions.
300 μm. The results in Figure 5 demonstrate 3.4 Wound contraction
that the human dermal fibroblasts grew well and
were evenly distributed within the gelatin-alginate The wound contraction results are displayed in
composite hydrogel. The cell survival rate was Figure 7. Compared with the size of the wound
maintained at >90% by day 7, indicating that the on the day of surgery, the contraction rate due to
composite hydrogel fulfilled the demands required the printed skin grafting group (Figure 7A) was
of a material for printing cells. 79 ± 6% at 4 weeks. In the blank (Figure 7D)
and control groups (Figure 7B and C), wound
3.3 Cell tracking and observation contraction was larger than that in the printed skin
The results of fluorescent cell tracking are graft group. After 4 weeks, the wound contraction
presented in Figure 6. Keratinocytes labeled in rate in controls with no endothelial cells was 81
± 10%, 85 ± 7% in the acellular controls, and 90
± 5% in the blank group. One week after surgery,
control group 10% gelatin and 4% alginate
3.00 2.699 2.652 there was no significant difference in wound
2.50 contraction between the printed skin grafting
OD values 2.00 1.094 group and two control groups which were no
1.50
endothelial cells and no cells, but the wound area
1.00 1.006
0.490 0.473 gradually decreased with time. Four weeks after
0.50 surgery, the wound contraction rate in the printed
0.00
24h 48h 72h skin grafting group was significantly lower than
Figure 4. CCK-8 cytotoxicity assay used to assess that in the blank group and cell-free control group
the cytotoxicity of the hydrogel over 24 h, 48 h, (P < 0.05). There was no significant difference
and 72 h on NHDFs. in wound contraction between the printed skin
A B C
Figure 5. Three-dimensional images of printed cells after live/dead staining. A, B, and C represent cells
1, 4, and 7 days after printing, respectively. Green staining indicates cell survival. Sample dimensions
were 1265 μm (length) × 1265 μm (width) × 305 μm (height).
58 International Journal of Bioprinting (2020)–Volume 6, Issue 1