
Page 61 - IJB-6-2
P. 61
Zolfagharian, et al.
maximum endpoint deflection in the subsequent this reason and vastly voltage driven model of the
cycle is observed by means of peak envelop lines, polyelectrolyte actuator, the deflections of both
as shown in Figure 8. Further experiments were actuators at the completion of cycle are quite alike.
conducted to compare the bending behavior of However, TO bioprinted actuator always outpaced
the two-material topology-optimized actuator the non-optimized one at all the tests during the
with entirely one material actuator. The results voltage “ON” interval.
proved the performance improvement of the The bending of the 3D-printed polyelectrolyte
two-material TO soft actuator compared to the actuators could be determined based on the
entirely bioprinted one, as shown in Figures 9 Donnan equilibrium theory , osmotic pressure
[43]
and 10. Looking at the details of Figure 10, it difference Δπ between both sides of the
can be seen that the two-material TO bioprinted polyelectrolyte actuator according to a formula
actuator exhibited larger bending compared to the developed by Shiga [16,44] , in which the osmotic
bioprinted material 2 lattice during the actuation pressure difference Δπ was equal to the maximum
process. Accordingly, when the input signal was 6DEY
turned off the bending relaxation of the topology- tensile stress σ as follows: ∆=π σ = L 2 (15)
optimized actuator took placed at 0.022 rad/s
which is greater than that shown by the material where, E is the elastic modulus, Y the bending
2 bioprinted soft actuator at 0.013 rad/s with the deflection, D the thickness, and L length of the actuator
same volume fraction but lighter structure. Due to prior to bending. Therefore, when the dimensions
(D, L, E) are constant, the larger osmotic pressure
A difference Δπ results in greater bending deflection.
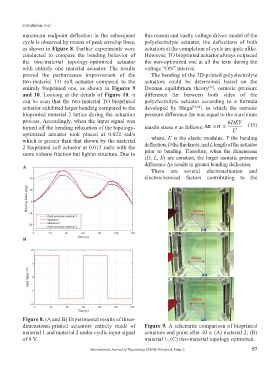
There are several electroactuation and
electrochemical factors contributing to the
A
B
B
C
Figure 8. (A and B) Experimental results of three-
dimensional-printed actuators entirely made of Figure 9. A schematic comparison of bioprinted
material 1 and material 2 under cyclic input signal actuators end point after 40 s; (A) material 2; (B)
of 8 V. material 1; (C) two-material topology optimized.
International Journal of Bioprinting (2020)–Volume 6, Issue 2 57