
Page 93 - IJB-6-2
P. 93
Kolan, et al.
interconnected, unlike the closed pores used in the other studies (B value varied between 5 and 9) [46,47] .
studies above. Hence, the compressive strength For spherical scaffolds, A was <1 and B was <5.
variation with porosity did not fit well with To verify the applicability of this trend to scaffolds
equation (1) and therefore, a slightly modified made with other materials, silicate glass scaffolds
version of equation (1) was used to fit the data by were fabricated with the same five architectures
introducing an additional empirical constant, A, as and at similar porosity levels. Compressive
given below: strength data for silicate glass scaffolds were fitted
2
σ Aeσ = o − BP (2) to the model (R > 0.98) to obtain the following set
of equations for different architectures:
where, − 6.7 p
σ - Strength of lattice; σ - Strength of dense part; Cubic scaffold: σ 4.0 eσ = o
o
A, B - Empirical constant; p - Porosity fraction; Gyroid scaffold: σ 1.1 eσ = − 6.0 p
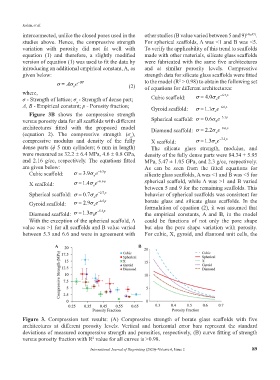
Figure 3B shows the compressive strength o
versus porosity data for all scaffolds with different Spherical scaffold: σ 0.6 eσ = 0 − 3.1p
architectures fitted with the proposed model Diamond scaffold: σ 2.2 eσ = − 8.6 p
(equation 2). The compressive strength (σ ), o
o
compressive modulus and density of the fully X scaffold: σ 1.3 eσ = o − 7.5 p
dense parts (ϕ 5 mm cylinders; 6 mm in length) The silicate glass strength, modulus, and
were measured as 32.2 ± 6.4 MPa, 4.6 ± 0.8 GPa, density of the fully dense parts were 84.34 ± 5.95
and 2.16 g/cc, respectively. The equations fitted MPa, 5.47 ± 1.05 GPa, and 2.3 g/cc, respectively.
are given below: As can be seen from the fitted equations for
Cubic scaffold: σ 3.9 eσ = o − 6.3 p silicate glass scaffolds, A was <1 and B was <5 for
X scaffold: σ 1.4 eσ = o − 6.6 p spherical scaffold, while A was >1 and B varied
between 5 and 9 for the remaining scaffolds. This
Spherical scaffold: σ 0.7 eσ = o − 2.7 p behavior of spherical scaffolds was consistent for
Gyroid scaffold: σ 2.9 eσ = o − 6.5 p borate glass and silicate glass scaffolds. In the
formulation of equation (2), it was assumed that
Diamond scaffold: σ 1.3 eσ = 0 − 5.3 p the empirical constants, A and B, in the model
With the exception of the spherical scaffold, A could be functions of not only the pore shape
value was >1 for all scaffolds and B value varied but also the pore shape variation with porosity.
between 5.3 and 6.6 and were in agreement with For cubic, X, gyroid, and diamond unit cells, the
A B
Figure 3. Compression test results: (A) Compressive strength of borate glass scaffolds with five
architectures at different porosity levels. Vertical and horizontal error bars represent the standard
deviations of measured compressive strength and porosities, respectively, (B) curve fitting of strength
versus porosity fraction with R value for all curves is >0.98.
2
International Journal of Bioprinting (2020)–Volume 6, Issue 2 89