
Page 94 - IJB-6-2
P. 94
3D-printed borate glass scaffolds for bone repair
overall pore shape remained relatively constant had a compressive strength of ~4 MPa. A significant
with increasing porosity. However, for spherical reduction in compressive modulus values for all
unit cell, pore shape at higher porosity (60%) scaffolds was also observed after 1 week, soaking
is different from pore shape at lower porosity in SBF. Cubic scaffolds had the highest compressive
(30%). The variation of pore shapes of cubic and modulus ranging from 1.2 to 0.2 GPa, and X scaffolds
spherical architectures is shown in Figure 2B. To had the lowest modulus ranging from 190 to 52 MPa,
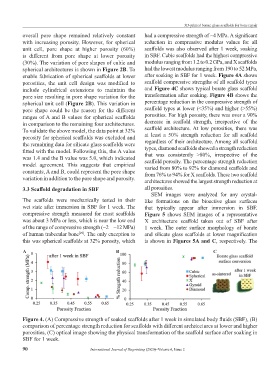
enable fabrication of spherical scaffolds at lower after soaking in SBF for 1 week. Figure 4A shows
porosities, the unit cell design was modified to scaffold compressive strengths of all scaffold types
include cylindrical extensions to maintain the and Figure 4C shows typical borate glass scaffold
pore size resulting in pore shape variation for the transformation after soaking. Figure 4B shows the
spherical unit cell (Figure 2B). This variation in percentage reduction in the compressive strength of
pore shape could be the reason for the different scaffold types at lower (<35%) and higher (>55%)
ranges of A and B values for spherical scaffolds porosities. For high porosity, there was over a 90%
in comparison to the remaining four architectures. decrease in scaffold strength, irrespective of the
To validate the above model, the data point at 32% scaffold architecture. At low porosities, there was
porosity for spherical scaffolds was excluded and at least a 50% strength reduction for all scaffold
the remaining data for silicate glass scaffolds were regardless of their architecture. Among all scaffold
fitted with the model. Following this, the A value types, diamond scaffolds showed a strength reduction
that was consistently >80%, irrespective of the
was 1.4 and the B value was 5.0, which indicated scaffold porosity. The percentage strength reduction
model agreement. This suggests that empirical varied from 80% to 92% for diamond scaffolds and
constants, A and B, could represent the pore shape from 76% to 94% for X scaffolds. These two scaffold
variation in addition to the pore shape and porosity. architectures showed the largest strength reduction at
3.3 Scaffold degradation in SBF all porosities.
SEM images were analyzed for any crystal-
The scaffolds were mechanically tested in their like formations on the bioactive glass surfaces
wet state after immersion in SBF for 1 week. The that typically appear after immersion in SBF.
compressive strength measured for most scaffolds Figure 5 shows SEM images of a representative
was about 3 MPa or less, which is near the low end X architecture scaffold taken out of SBF after
of the range of compressive strength (~2 – ~12 MPa) 1 week. The outer surface morphology of borate
of human trabecular bone . The only exception to and silicate glass scaffolds at lower magnification
[29]
this was spherical scaffolds at 32% porosity, which is shown in Figures 5A and C, respectively. The
A B C
Figure 4. (A) Compressive strength of soaked scaffolds after 1 week in simulated body fluids (SBF), (B)
comparison of percentage strength reduction for scaffolds with different architectures at lower and higher
porosities, (C) optical image showing the physical transformation of the scaffold surface after soaking in
SBF for 1 week.
90 International Journal of Bioprinting (2020)–Volume 6, Issue 2