
Page 241 - IJB-10-6
P. 241
International Journal of Bioprinting DIW of concave hydroxyapatite scaffolds
for D, and 3.34% for S. The discrepancy in total porosity (Figure 3d), which is an estimation of pore size distribution
across different TPMS patterns can be attributed to the as the diameter of the largest sphere that can be fitted
difficulty of printing TPMS geometries with a 100% infill completely inside the pore. All geometries had a peak
57
using DIW and the formation of some unwanted pores due under 40 µm, corresponding to the closed porosity within
to incomplete merging of adjacent filaments. the ink filaments, generated during the hardening process
The connectivity of the pores (Figure 3b) measured (i.e., when the Pluronic hydrogel is released, as displayed
38
5
5
using CTAn software was 8.93 × 10 for OP, 2.03 × 10 in Figure 1 and described in previous works ) and small
for G, 1.34 × 10 for D, and 2.86 × 10 for S. This is in gaps between adjacent (not completely merged) filaments,
5
5
especially in TPMS-based structures with 100% infill.
agreement with the corresponding binary volumes (Figure
3c), where OP has more interconnected pores. However, Above this threshold, the trabecular separation for OP
the pore geometry was significantly different between the was in the range of 40–96 µm, consistent with the distance
OP and TPMS-based structures. For the control, elongated between filaments designed in the G-code (i.e., 62.5 µm).
The second peak included mostly pores in the range of 40–
pores, crossing the scaffold in orthogonal directions, with 192 µm for G, 40–210 µm for D, and 40–216 µm for S; the
mostly convex surfaces and diameters of <100 µm were
formed. In contrast, the TPMS-based patterns resulted in mean trabecular separation increased in the same order.
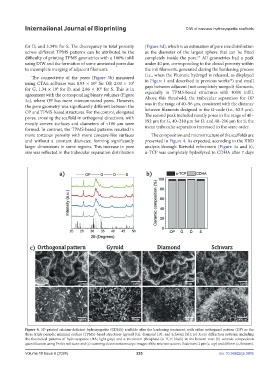
more tortuous porosity with more concave-like surfaces The composition and microstructure of the scaffolds are
and without a constant diameter, forming significantly presented in Figure 4. As expected, according to the XRD
larger dimensions in some regions. This increase in pore analysis through Rietveld refinement (Figure 4a and b),
size was reflected in the trabecular separation distribution α-TCP was completely hydrolyzed to CDHA after 7 days
Figure 4. 3D-printed calcium-deficient hydroxyapatite (CDHA) scaffolds after the hardening treatment, with either orthogonal pattern (OP) or the
three triply periodic minimal surface (TPMS)-based structures (gyroid [G], diamond [D], and Schwarz [S]): (a) X-ray diffraction patterns, including
the theoretical patterns of hydroxyapatite (HA; light grey) and α-tricalcium phosphate (α-TCP; black) in the bottom row; (b) ceramic composition
quantification using Profex software; and (c) scanning electron microscope images of the microstructures. Scale bars: 2 μm (c, top) and 400 nm (c, bottom).
Volume 10 Issue 6 (2024) 233 doi: 10.36922/ijb.3805