
Page 243 - IJB-10-6
P. 243
International Journal of Bioprinting DIW of concave hydroxyapatite scaffolds
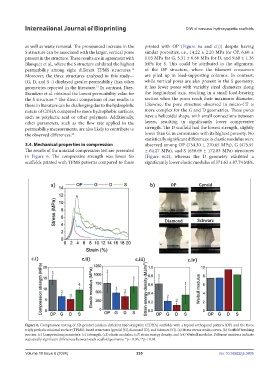
as well as waste removal. The pronounced increase in the printed with OP (Figure 6a and c(i)) despite having
S structure can be associated with the larger, vertical pores similar porosities, i.e., 14.22 ± 2.20 MPa for OP, 6.60 ±
present in the structure. These results are in agreement with 1.03 MPa for G, 5.31 ± 0.66 MPa for D, and 9.60 ± 1.36
Blanquer et al., where the S structure exhibited the highest MPa for S. This could be attributed to the alignment
permeability among eight different TPMS structures. of the OP structure, where the filament crossovers
14
Moreover, the three structures analyzed in this study— are piled up in load-supporting columns. In contrast,
(G, D, and S -) displayed greater permeability than other while vertical pores are also present in the S geometry,
14
geometries reported in the literature. In contrast, Diez- it has fewer pores with variably sized diameters along
Escudero et al. obtained the lowest permeability value for the longitudinal axis, resulting in a small load-bearing
19
the S structure. The direct comparison of our results to section when the pores reach their maximum diameter.
those in literature can be challenging due to the hydrophilic Likewise, the pore structure observed in micro-CT is
nature of CDHA compared to more hydrophobic surfaces, more complex for the G and D geometries. These pores
such as polylactic acid or other polymers. Additionally, have a helicoidal shape, with small connections between
other parameters, such as the flow rate applied in the layers, resulting in significantly lower compressive
permeability measurements, are also likely to contribute to strength. The D scaffold had the lowest strength, slightly
the observed differences. 20 lower than G, in consonance with its highest porosity. No
statistically significant differences in elastic modulus were
3.4. Mechanical properties in compression observed among OP (754.30 ± 270.65 MPa), G (475.91
The results of the uniaxial compression test are presented ± 64.27 MPa), and S (658.69 ± 172.83 MPa) structures
in Figure 6. The compressive strength was lower for (Figure 6c2), whereas the D geometry exhibited a
scaffolds printed with TPMS patterns compared to those significantly lower elastic modulus of 371.63 ± 87.74 MPa.
Figure 6. Compression testing of 3D-printed calcium-deficient hydroxyapatite (CDHA) scaffolds with a typical orthogonal pattern (OP) and the three
triply periodic minimal surface (TPMS)-based structures (gyroid [G], diamond [D], and Schwarz [S]). (a) Stress versus strain curves. (b) Scaffold breaking
process. (c) Compression parameters: (c1) strength, (c2) elastic modulus, (c3) strain energy density, and (c4) Weibull modulus. Different numbers indicate
statistically significant differences between each scaffold geometry. *p < 0.05, **p < 0.01.
Volume 10 Issue 6 (2024) 235 doi: 10.36922/ijb.3805