
Page 247 - IJB-10-6
P. 247
International Journal of Bioprinting DIW of concave hydroxyapatite scaffolds
coverage was observed of the surface of the glass cover scanning confocal microscopy (LSCM), which revealed
slips used as control. In the OP structure, no cells were that cell morphology correlates with cell quantification.
observed on the upper layer, but abundant cells were Nonetheless, the formation of cell aggregates should be
found in the underlying layer. In contrast, TPMS-based further studied.
architectures displayed well-distributed cells over the
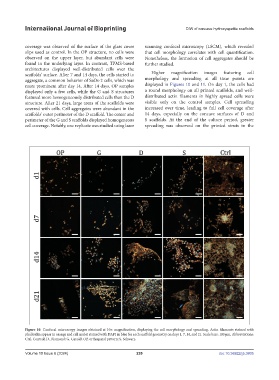
scaffolds’ surface. After 7 and 14 days, the cells started to Higher magnification images featuring cell
aggregate, a common behavior of SaOs-2 cells, which was morphology and spreading at all time points are
more prominent after day 14. After 14 days, OP samples displayed in Figures 10 and 11. On day 1, the cells had
displayed only a few cells, while the G and S structures a round morphology on all printed scaffolds, and well-
featured more homogeneously distributed cells than the D distributed actin filaments in highly spread cells were
structure. After 21 days, large areas of the scaffolds were visible only on the control samples. Cell spreading
covered with cells. Cell aggregates were abundant in the increased over time, leading to full cell coverage after
scaffolds’ outer perimeter of the D scaffold. The center and 14 days, especially on the concave surfaces of D and
perimeter of the G and S scaffolds displayed homogeneous S scaffolds. At the end of the culture period, greater
cell coverage. Notably, one replicate was studied using laser spreading was observed on the printed struts in the
Figure 10. Confocal microscopy images obtained at 10× magnification, displaying the cell morphology and spreading. Actin filaments stained with
phalloidin appear in orange and cell nuclei stained with DAPI in blue for each scaffold geometry on days 1, 7, 14, and 21. Scale bars: 100 µm. Abbreviations:
Ctrl, Control; D, Diamond; G, Gyroid; OP, orthogonal pattern; S, Schwarz.
Volume 10 Issue 6 (2024) 239 doi: 10.36922/ijb.3805