
Page 485 - IJB-10-6
P. 485
International Journal of Bioprinting Nanomaterial-bioinks for DLP bioprinting
tissue program (6500 rpm for 30 s with 20 s rest) in three replicates. Statistical significance was determined as
cycles with 800 µL of 10% acetic acid. ARS extraction from *p < 0.05, **p < 0.01, ***p < 0.001, and ****p < 0.0001.
the homogenized samples was achieved by shaking them
for 24 h. Following extraction, the samples were heated 3. Results
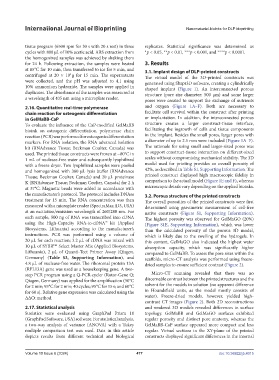
at 85°C for 10 min, then transferred to ice for 5 min, and 3.1. Implant design of DLP-printed constructs
centrifuged at 20 × 10 g for 15 min. The supernatants The virtual model of the 3D-printed constructs was
3
were collected, and the pH was adjusted to 4.1 using generated using Shapr3D software, creating a cylindrically
10% ammonium hydroxide. The samples were applied in shaped implant (Figure 1). An interconnected porous
duplicates. The absorbance of the samples was measured at structure (pore size diameter: 500 µm) and some larger
a wavelength of 405 nm using a microplate reader. pores were created to support the exchange of nutrients
2.16. Quantitative real-time polymerase and oxygen (Figure 1A–F). Both are necessary to
chain reaction for osteogenic differentiation facilitate cell survival within the construct after printing
in GelMaBB-CaP or implantation. In addition, the interconnected porous
To evaluate the influence of the CaP-modified GelMaBB structure creates a larger construct-tissue interface,
bioink on osteogenic differentiation, polymerase chain facilitating the ingrowth of cells and tissue components
reaction (PCR) was performed for osteogenic differentiation in the implant. Besides the small pores, larger pores with
markers. For RNA isolation, the RNA advanced isolation a diameter of up to 2.5 mm were included (Figure 1A–F).
kit (RNAdvance Tissue; Beckman Coulter, Canada) was The rationale for using small and larger-sized pores was
used. The printed tissue constructs were frozen at −80°C in to support construct-tissue interaction on different-sized
1 mL of nuclease-free water and subsequently lyophilized scales without compromising mechanical stability. The 3D
with a freeze dryer. Two lyophilized samples were pooled model used for printing provides an overall porosity of
and homogenized with 380 µL lysis buffer (RNAdvance 42%, as described in Table S1, Supporting Information. The
Tissue; Beckman Coulter, Canada) and 20 µL proteinase printed construct displayed high macroscopic fidelity in
K (RNAdvance Tissue; Beckman Coulter, Canada) for 2 h comparison to the actual model (Figure 1E and F), whereas
at 37°C. Magnetic beads were added in accordance with microscopic details vary depending on the applied bioinks.
the manufacturer’s protocol. The protocol includes DNAse 3.2. Porous structure of the printed constructs
treatment for 15 min. The RNA concentration was then The overall porosities of the printed constructs were first
measured with a microplate reader (SpectraMax iD3, USA) determined using gravimetric measurement of cell-free
at an excitation/emission wavelength of 260/280 nm. For native constructs (Figure S1, Supporting Information).
each sample, 500 ng of RNA was transcribed into cDNA The highest porosity was observed for GelMaGO (20%)
using the High-Capacity RNA-to-cDNA™ kit (Applied (Figure S1E, Supporting Information), which was lower
Biosystems, Lithuania) according to the manufacturer’s than the calculated porosity of the porous 3D model,
instructions. PCR was performed using a volume of which is likely due to the swelling of the hydrogels. In
20 µL for each reaction; 3.2 µL of cDNA was mixed with this context, GelMaGO also indicated the highest water
10 µL of SYBR Select Master Mix (Applied Biosystems, absorption capacity, which was significantly higher
TM
Lithuania), 2 µL of Quanti-Tect Primer Assay (Qiagen, compared to GelMaBB. To assess the pore sizes within the
Germany) (Table S3, Supporting Information), and scaffolds, micro-CT analysis was performed using freeze-
4.8 µL of nuclease-free water. The ribosomal protein 13A dried samples to ensure sufficient contrast (Figure 2).
(RPL13A) gene was used as a housekeeping gene. A two-
step PCR program using a Q-PCR-cycler (Rotor-Gene Q; Micro-CT scanning revealed that there was no
Qiagen, Germany) was applied for the amplification (50°C discernable contrast between the printed structures and the
for 2 min; 95°C for 2 min; 40 cycles; 95°C for 15 s; and 60°C solvent for the models in solution (no apparent difference
for 60 s). Relative gene expression was calculated using the in Houndsfield units, as the model mostly consists of
ΔΔCt method. water). Freeze-dried models, however, yielded high-
contrast CT images (Figure 2). Both 2D reconstructions
2.17. Statistical analysis and rendered 3D models revealed differences in surface
Statistics were evaluated using GraphPad Prism 10 topology. GelMaBB and GelMaGO surfaces exhibited
(GraphPad Software, USA) software. For statistical analysis, regular porosity and distinct pore anatomy, whereas the
a two-way analysis of variance (ANOVA) with a Tukey GelMaBB-CaP surface appeared more compact and less
multiple comparison test was used. Data in this article regular. Virtual sections in the XY-plane of the printed
depicts results from different technical and biological constructs displayed significant differences in the internal
Volume 10 Issue 6 (2024) 477 doi: 10.36922/ijb.4015