
Page 486 - IJB-10-6
P. 486
International Journal of Bioprinting Nanomaterial-bioinks for DLP bioprinting
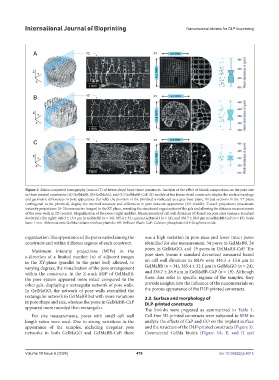
Figure 2. Micro-computed tomography (microCT) of freeze-dried bone tissue constructs. Analysis of the effect of bioink composition on the pore size
in three printed constructs: (A) GelMaBB, (B) GelMaGO, and (C) GelMaBB-CaP. 3D models of the freeze-dried constructs display the surface topology
and geometric differences in pore appearance (far left); the position of the printbed is indicated as a grey base plane. Virtual sections in the YZ plane
(orthogonal to the printbed), display the internal structure and differences in pore network appearance (left middle). Z-stack projections (maximum
intensity projections: 18–26 consecutive images) in the XY plane, revealing the structured organization of the gels and allowing for distance measurements
of the pore walls in 2D (center). Magnification of the pores (right middle). Measurements of cell wall distances (d) based on pore sizes (mean ± standard
deviation) (far right): 446.3 ± 13.6 µm in GelMaBB (n = 34), 385.4 ± 32.1 µm in GelMaGO (n = 24), and 336.7 ± 28.9 µm in GelMaBB-CaP (n = 19). Scale
bars: 1 mm. Abbreviations: GelMa: Gelatin methacrylamide; BB: Brilliant Black; CaP: Calcium phosphate; GO: Graphene oxide.
organization. The appearance of the pores varied among the was a high variation in pore sizes and fewer intact pores
constructs and within different regions of each construct. identified for size measurement: 34 pores in GelMaBB, 24
Maximum intensity projections (MIPs) in the pores in GelMaGO, and 19 pores in GelMaBB-CaP. The
z-direction of a limited number (n) of adjacent images pore sizes (mean ± standard deviation) measured based
in the XY-plane (parallel to the print bed) allowed, to on cell wall distances in MIPs were 446.3 ± 13.6 µm in
varying degrees, the visualization of the pore arrangement GelMaBB (n = 34), 385.4 ± 32.1 µm in GelMaGO (n = 24),
within the constructs. In the Z-stack MIP of GelMaBB, and 336.7 ± 28.9 µm in GelMaBB-CaP (n = 19). Although
the pore system appeared more intact compared to the these data refer to specific regions of the samples, they
other gels, displaying a rectangular network of pore walls. provide insights into the influence of the nanomaterials on
In GelMaGO, the network of pore walls resembled the the porous appearance of the DLP-printed constructs.
rectangular network in GelMaBB but with more variations 3.3. Surface and morphology of
in pore shape and size, whereas the pores in GelMaBB-CaP DLP-printed constructs
appeared more rounded than rectangular. The bioinks were prepared as summarized in Table 1.
For size measurements, pores with small cell wall Cell-free 3D-printed constructs were subjected to SEM to
length ratios were used. Due to strong variations in the analyze the effects of CaP and GO on the implant surface
appearance of the samples, including irregular pore and the structure of the DLP-printed constructs (Figure 3).
networks in both GelMaGO and GelMaBB-CaP, there Commercial GelMa bioink (Figure 3A, E, and I) and
Volume 10 Issue 6 (2024) 478 doi: 10.36922/ijb.4015