
Page 109 - IJB-7-1
P. 109
Zheng, et al.
Table 1. Primer sequences of osteogenic genes
Osteogenic genes Primer sequences
HSPA5 F: 5’-CACGGTCTTTGACGCCAAG-3’
R: 5’-CCAAATAAGCCTCAGCGGTTT-3’
ALP F: 5’-CGGATCCTGACCAAAAACC-3’
R: 5’-TCATGATGTCCGTGGTCAAT-3’
BMP2 F: 5’-GAATGACTGGATCGTGGCACCTC-3’
R: 5’-GGCATGGTTAGTGGAGTTCAGGTG-3’
Col1α1 F: 5’-CATGTTCAGCTTTGTGGACCT-3’
R: 5’-GCAGCTGACTTCAGGGATGT-3’
OCN F: 5’-CACCATGAGGACCCTCTCTC-3’
R: 5’-TGGACATGAAGGCTTTGTCA-3’
Osterix F: 5’-TCTCCATCTGCCTGACTCCT-3’
R: 5’-AGCGTATGGCTTCTTTGTGC-3’
Runx2 F: 5’-GACTGTGGTTACCGTCATGGC-3’
R: 5’-ACTTGGTTTTTCATAACAGCGGA-3’
GAPDH F: 5’-CATGTACGTTGCTATCCAGGC-3’
R: 5’-CTCCTTAATGTCACGCACGAT-3’
F, forward; R, reverse; BMP2, bone morphogenetic protein 2; ALP, alkaline phosphate; col1a1, collagen type I; OCN; osteocalcin.
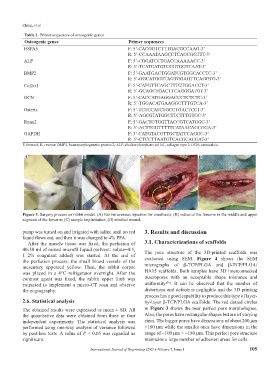
A B C D
Figure 3. Surgery process on rabbit model. (A) Ear intravenous injection for anesthesia; (B) radius of the forearm in the middle and upper
segment of the forearm; (C) sample implantation; (D) stitched wound.
pump was turned on and irrigated with saline until no red 3. Results and discussion
liquid flows out, and then it was changed to 4% PFA.
After the muscle tissue was fixed, the perfusion of 3.1. Characterizations of scaffolds
40-50 ml of mixed microfil liquid (solvent: solute=4:5, The pore structure of the 3D-printed scaffolds was
1–2% coagulant added) was started. At the end of
the perfusion process, the small blood vessels of the evaluated using SEM. Figure 4 shows the SEM
mesentery appeared yellow. Then, the rabbit corpse micrographs of β-TCP/PLGA and β-TCP/PLGA/
was placed in a 4°C refrigerator overnight. After the HA15 scaffolds. Both samples have 3D interconnected
contrast agent was fixed, the rabbit upper limb was macropores with an acceptable shape tolerance and
[36]
extracted to implement a micro-CT scan and observe uniformity . It can be observed that the number of
the angiography. distortions and defects is negligible and the 3D printing
process has a good capability to produce this type of layer-
2.6. Statistical analysis by-layer β-TCP/PLGA scaffolds. The red dotted circles
The obtained results were expressed as mean ± SD. All in Figure 3 shows the near perfect pore morphologies.
the quantitative data were obtained from three or four Also, the pores have rectangular shapes but are of varying
independent experiments. The statistical analysis was sizes. The bigger pores have dimensions of about 200 μm
performed using one-way analysis of variance followed ×180 μm while the smaller ones have dimensions in the
by post-hoc tests. A value of P < 0.05 was regarded as range of ~100 μm × ~180 μm. This perfect pore structure
significant. maintains a large number of adhesion areas for cells.
International Journal of Bioprinting (2021)–Volume 7, Issue 1 105