
Page 97 - IJB-7-4
P. 97
Zhang, et al.
than in the C group, suggesting that a higher extent of 3.4. The scaffolds loaded with growth factors
signaling cascade was activated during the chondrogenic promoted osteochondral regeneration in vivo
differentiation of BMSCs over the C+TGF-β group than
C group. To investigate whether the composite constructs stimulate
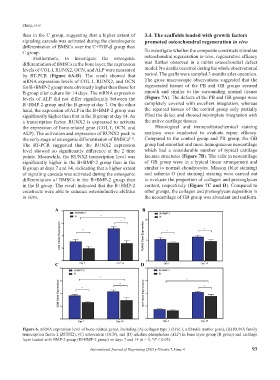
Furthermore, to investigate the osteogenic osteochondral regeneration in vivo, regenerative efficacy
differentiation of BMSCs in the bone layer, the expression was further observed in a rabbit osteochondral defect
levels of COL I, RUNX2, OCN, and ALP were measured model. No deaths occurred during the whole observational
by RT-PCR (Figure 6A-D). The result showed that period. The grafts were sampled 3 months after operation.
mRNA expression levels of COL I, RUNX2, and OCN The gross macroscopic observations suggested that the
for B+BMP-2 group were obviously higher than those for regenerated tissues of the PB and GB groups seemed
B group after culture for 14 days. The mRNA expression smooth and similar to the surrounding normal tissues
levels of ALP did not differ significantly between the (Figure 7A). The defects of the PB and GB groups were
B+BMP-2 group and the B group at day 7. On the other completely covered with excellent integration, whereas
hand, the expression of ALP in the B+BMP-2 group was the repaired tissues of the control group only partially
significantly higher than that in the B group at day 14. As filled the defect and showed incomplete integration with
a transcription factor, RUNX2 is expressed to activate the native cartilage tissues.
the expression of bone-related gene (COL I, OCN, and Histological and immunohistochemical staining
ALP). The activation and expression of RUNX2 peak in analyses were conducted to evaluate repair efficacy.
the early stage of osteogenic differentiation of BMSCs . Compared to the control group and PB group, the GB
[11]
The RT-PCR suggested that the RUNX2 expression group had smoother and more homogeneous neocartilage
level showed no significantly difference at the 2 time which had a considerable number of typical cartilage
points. Meanwhile, the RUNX2 transcription level was lacunae structures (Figure 7B). The cells in neocartilage
significantly higher in the B+BMP-2 group than in the of GB group were in a typical linear arrangement and
B group at days 7 and 14, indicating that a higher extent similar to normal chondrocytes. Masson (blue staining)
of signaling cascade was activated during the osteogenic and safranin O (red staining) staining were carried out
differentiation of BMSCs in the B+BMP-2 group than to evaluate the proportion of collagen and proteoglycan
in the B group. The result indicated that the B+BMP-2 content, respectively (Figure 7C and D). Compared to
constructs were able to enhance osteoinductive abilities other groups, the collagen and proteoglycan deposition in
in vitro. the neocartilage of GB group was abundant and uniform.
A B
C D
Figure 6. mRNA expression level of bone-related genes, including (A) collagen type I (COL I, a fibrotic marker gene), (B) RUNX family
transcription factor 2 (RUNX2), (C) osteocalcin (OCN), and (D) alkaline phosphatase (ALP) in bone layer group (B group) and cartilage
layer loaded with BMP-2 group (B+BMP-2 group) on days 7 and 14 (n = 3; *P < 0.05).
International Journal of Bioprinting (2021)–Volume 7, Issue 4 93