
Page 123 - IJB-8-3
P. 123
Zheng, et al.
A B C
D E F
G
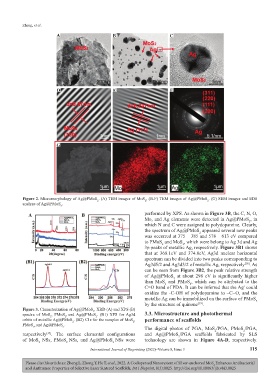
Figure 2. Micromorphology of Ag@PMoS . (A) TEM images of MoS , (B-F) TEM images of Ag@PMoS . (G) SEM images and EDS
2
2
2
analyze of Ag@PMoS .
2
performed by XPS. As shown in Figure 3B, the C, N, O,
Mo, and Ag elements were detected in Ag@PMoS , in
2
which N and C were assigned to polydopamine. Clearly,
the spectrum of Ag@PMoS appeared several new peaks
2
was occurred at 375 – 385 and 578 – 613 eV compared
to PMoS and MoS , which were belong to Ag 3d and Ag
2
2
3p peaks of metallic Ag, respectively. Figure 3B1 shows
that at 368.1eV and 374.0eV, Ag3d nuclear horizontal
spectrum can be divided into two peaks corresponding to
Ag3d5/2 and Ag3d3/2 of metallic Ag, respectively . As
[38]
can be seen from Figure 3B2, the peak relative strength
of Ag@PMoS at about 298 eV is significantly higher
2
than MoS and PMoS , which can be attributed to the
2
2
C=O band of PDA. It can be inferred that the Ag could
+
oxidize the -C-OH of polydopamine to –C=O, and the
metallic Ag can be immobilized on the surface of PMoS 2
by the structure of quinone .
[39]
Figure 3. Characterization of Ag@PMoS . XRD (A) and XPS (B)
2
spectra of MoS , PMoS , and Ag@PMoS . (B1) XPS for Ag3d 3.3. Microstructure and photothermal
2
2
2
orbits of metallic Ag@PMoS . (B2) C1s for the samples of MoS , performance of scaffolds
2
2
PMoS ,and Ag@PMoS .
2 2
The digital photos of PGA, MoS /PGA, PMoS /PGA,
2
2
respectively . The surface elemental configurations and Ag@PMoS /PGA scaffolds fabricated by SLS
[37]
2
of MoS NSs, PMoS NSs, and Ag@PMoS NSs were technology are shown in Figure 4A-D, respectively.
2
2
2
International Journal of Bioprinting (2022)–Volume 8, Issue 3 115
Please cite this article as: Zheng L, Zhong Y, He T, et al., 2022, A Codispersed Nanosystem of Silver-anchored MoS Enhances Antibacterial
2
and Antitumor Properties of Selective Laser Sintered Scaffolds, Int J Bioprint, 8(3):0025. http://doi.org/10.18063/ijb.v8i3.0025