
Page 53 - IJB-8-3
P. 53
Noroozi, et al.:
Table 2. Geometrical, printing, and materials characteristics of tested scaffold specimens
Specimen number Description K Material Printing direction µ-CT
S1H Gyroid -- CNT-PLA H
S2H I-WP -- CNT-PLA H
S3H G+I-WP 20.00 CNT-PLA H *
S4H G+D 20.00 CNT-PLA H
S5H G+D 0.30 CNT-PLA H
S6H G+D 0.15 CNT-PLA H
S7H G+D 0.10 CNT-PLA H
S8H Diamond (D) -- CNT-PLA H
S9V G+I-WP 20.00 PLA V
S10V G+D 20.00 PLA V *
S11V G+I-WP 20.00 CNT-PLA V
S12V G+D 20.00 CNT-PLA V
S13H G+I-WP 20.00 PLA H
S14H G+D 20.00 PLA H
A B A E
F
B
C G
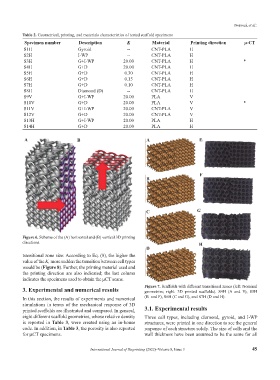
Figure 6. Scheme of the (A) horizontal and (B) vertical 3D printing
directions. H
D
transitional zone size: According to Eq. (8), the higher the
value of the K, more sudden the transition between cell types
would be (Figure 8). Further, the printing material used and
the printing direction are also indicated; the last column
indicates the specimens used to obtain the µCT scans.
3. Experimental and numerical results Figure 7. Scaffolds with different transitional zones (left: Nominal
geometries; right: 3D printed scaffolds). S4H (A and E), S5H
In this section, the results of experiments and numerical (B and F), S6H (C and G), and S7H (D and H).
simulations in terms of the mechanical response of 3D
printed scaffolds are illustrated and compared. In general, 3.1. Experimental results
eight different scaffold geometries, whose relative density Three cell types, including diamond, gyroid, and I-WP
is reported in Table 3, were created using an in-house structures, were printed in one direction to see the general
code. In addition, in Table 3, the porosity is also reported response of each structure solely. The size of cells and the
for µCT specimens. wall thickness have been assumed to be the same for all
International Journal of Bioprinting (2022)–Volume 8, Issue 3 45