
Page 56 - IJB-8-3
P. 56
Additive Manufacturing of Bone Scaffolds
3.2. Finite element modeling results geometry presents a good match with the obtained load-
displacement curves determined from compression tests.
First, mesh convergence study has been performed for However, as will be discussed further, the real geometry
one compression test to define the optimum element size. has led to more accurate results.
Second, the results of load-displacement curves of the Two printed scaffolds, S3H and S10V, were chosen
linear part of experiments have been compared with the for µCT scan. The resolution of the reported STL files
FEM results to evaluate and verify the accuracy of the
FEM. The total force acting on the middle cross-section was around 25 µ. However, due to the limitation of the
of the scaffold has been extracted from the output file. computational resources, a re-mesh strategy was adopted
The FE model with the highest number of finite elements so that the final resolution was in the range 80 – 125 µ.
(around 5.2E+6 elements) has been assumed to provide Specimens 3 and 10 were scanned using µCT and the
the reference solution, and the other cases have been corresponding numerical model for the FE simulation
compared to it. According to Figure 13, the optimum was created using solid elements.
mesh has been identified to possess around 2,000,000 The Von Mises stress contours show that scaffolds
elements, leading to about 96.97% accuracy. tend to fail sooner in the gyroid section than in both
In Figure 14, the FEM results related to the nominal I-WP and diamond sections. The comparison between
and real geometry have been compared with experimental I-WP and gyroid is not challenging because the latter
results in the linear regime for specimen number 3 and is bending dominated while the first one is stretching
10, in subfigures a and b, respectively. In general, the dominated, meaning that I-WP structure is keen to fail
linear response for both the scaffold’s nominal and real under the buckling mechanism. As a consequence, the
I-WP structure fails at a greater load value than the
gyroid one. However, the combination of gyroid and
diamond structure requires a more detailed explanation
because both of them are bending-dominated TPMS
structures and the cell size and thickness are the same
for each part.
According to Table 3, the porosity of gyroid and
diamond structures is 75.51% and 69.71%, respectively.
Based on the work of Ashby et al. , the more porous
[59]
the scaffold, the lower the cellular structure’s strength
must be. Therefore, apart from any specific geometry
and topology of gyroid and diamond structures, since the
gyroid is more porous than the diamond, it will fail sooner.
FEM model and experiments are in good agreement with
this statement. Specimen 10 has such a structure and
the FEM Von Mises stress results for both the real and
nominal geometry are shown in Figure 15.
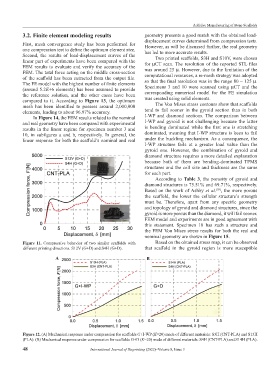
Figure 11. Compressive behavior of two similar scaffolds with Based on the obtained stress map, it can be observed
different printing directions. S12V (G+D) and S4H (G+D). that scaffold in the gyroid region is more susceptible
A B
Figure 12. (A) Mechanical response under compression for scaffolds G+I-WP (K=20) made of different materials: S3H (CNT-PLA) and S13H
(PLA). (B) Mechanical response under compression for scaffolds G+D (K=20) made of different materials: S4H (CNT-PLA) and S14H (PLA).
48 International Journal of Bioprinting (2022)–Volume 8, Issue 3