
Page 54 - IJB-8-3
P. 54
Additive Manufacturing of Bone Scaffolds
scaffolds. In Figure 9A, the results of the compression test 2
for single-cell scaffolds are presented. According to the E ∝ ρ
load-displacement curve, the diamond structure shows the E s ρ s (9)
stiffest response. Despite the cell geometry, the stiffness of
the scaffold is mainly related to its porosity (Table 3). This Where, ρ indicated the density of the reference
s
behavior has been stated and proven by Ashby et al. . material with Young’s modulus E , while ρ and E
[59]
s
The higher the porosity, the lower the density of scaffolds represent the corresponding quantities of the porous
and the lower the stiffness would be; a relationship suitable material of interest, namely, the scaffolds. The above
to estimate the Young’s modulus of porous materials has relationship does not account for the geometry of the
been proposed in the following form. pores, so the scaffolds’ behavior weakly depends on the
cell type, while the porosity, that is, the relative density,
Table 3. Porosity of the designed scaffolds. plays the main role. In addition, according to the curves
Specimen number Description Porosity % and the data in Table 3, both I-WP and gyroid structures
S1H Gyroid 75.51 have approximately the same porosity but different
responses. It is worth noticing that lattices are either
S2H I-WP 74.08 bending or stretching dominated structures, and I-WP has
S3H G+I-WP 74.27 a stretching-dominated response . This is why the I-WP
[56]
S4H G+D 72.25 lattice has a much higher stiffness than the gyroid lattice.
S5H G+D 72.89 Thus, whether the scaffold is a bending or stretching
S6H G+D 73.15 dominated structure define the overall response for
S7H G+D 73.37 scaffolds with the same porosity.
S8H Diamond 69.71 Even though the natural tissues do have different
Micro-CT3 G+I-WP (3) 73.52 cell sizes and types, the variation between two structures
Micro-CT10 G+D (4) 71.73 is usually gradual, that is, a smooth transitional zone
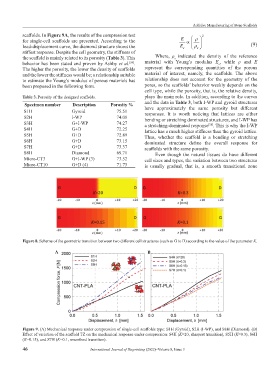
Figure 8. Scheme of the geometric transition between two different cell structures (such as G to D) according to the value of the parameter K.
A B
Figure 9. (A) Mechanical response under compression of single-cell scaffolds type: S1H (Gyroid), S2H (I-WP), and S8H (Diamond). (B)
Effect of variation of the scaffold TZ on the mechanical response under compression: S4H (K=20, sharpest transition), S5H (K=0.3), S6H
(K=0.15), and S7H (K=0.1, smoothest transition).
46 International Journal of Bioprinting (2022)–Volume 8, Issue 3