
Page 57 - IJB-8-3
P. 57
Noroozi, et al.:
to fail than the diamond region. However, the stress
contour for the nominal geometry differs from the real
specimen in some points. First, the nominal geometry
has sharp boundaries which are responsible for stress
concentration; on the other hand, in real cases, this does
not occur because the material distribution is not sharp
being the FDM printing method not so precise to create
sharp boundaries. Hence, the predictions based on the real
geometry obtained through the µCT scan and lead to more
precise results than the nominal scaffolds. In addition, the
direction where stress concentration takes place in the
middle of the gyroid section is slightly different when
the nominal or real geometries are considered. Of course,
load-displacement curves obtained for experimental and
nominal geometries indicate that the nominal geometry
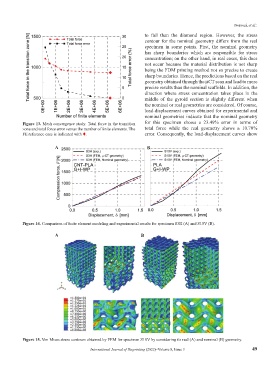
Figure 13. Mesh convergence study: Total force in the transition for this specimen shows a 23.49% error in terms of
zone and total force error versus the number of finite elements. The total force while the real geometry shows a 10.70%
FE reference case is indicated with . error. Consequently, the load-displacement curves show
A B
Figure 14. Comparison of finite element modeling and experimental results for specimen S3H (A) and S10V (B).
A B
Figure 15. Von Mises stress contours obtained by FEM for specimen S10V by considering its real (A) and nominal (B) geometry.
International Journal of Bioprinting (2022)–Volume 8, Issue 3 49