
Page 83 - IJB-8-3
P. 83
Alshehri, et al.
A E
B
C
D
Figure 4. Cell proliferation in 3D constructs. (A-D) Bright-field microscopy images and fluorescence images (live cells in green, dead cells
in red) of HEK cells in 3D constructs after 1 day of culture at varying GVNP concentrations (A: Control, B: 250 μg/mL, C: 500 μg/mL, D:
750 μg/mL). Scale bar: 100 μm. (E) The percentage of cell proliferation rate normalized against the initial time point day 0 was shown as
mean ± SD (n = 6). **P < 0.01, ****P < 0.0001.
A B C E
D
F G
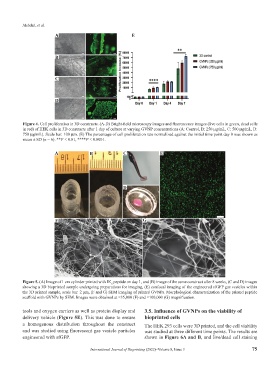
Figure 5. (A) Image of 1 cm cylinder printed with IK peptide on day 1, and (B) image of the same construct after 8 weeks, (C and D) images
6
showing a 3D bioprinted sample undergoing preparations for imaging, (E) confocal imaging of the engineered sfGFP gas vesicles within
the 3D printed sample, scale bar: 2 μm, (F and G) SEM imaging of printed GVNPs. Morphological characterization of the printed peptide
scaffold with GVNPs by SEM. Images were obtained at ×35,000 (F) and ×100,000 (G) magnification.
tools and oxygen carriers as well as protein display and 3.5. Influence of GVNPs on the viability of
delivery vehicle (Figure 5E). This was done to ensure bioprinted cells
a homogenous distribution throughout the construct The HEK 293 cells were 3D printed, and the cell viability
and was studied using fluorescent gas vesicle particles was studied at three different time points. The results are
engineered with sfGFP. shown in Figure 6A and B, and live/dead cell staining
International Journal of Bioprinting (2022)–Volume 8, Issue 3 75