
Page 217 - IJB-8-4
P. 217
Dong, et al.
A C
B D
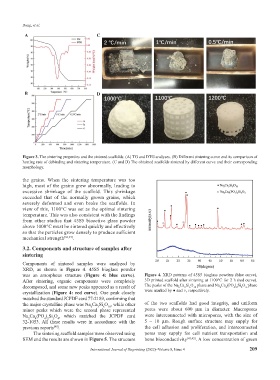
Figure 3. The sintering properties and the sintered scaffolds. (A) TG and DTG analyses. (B) Different sintering curve and its comparison of
heating rate of debinding and sintering temperature. (C and D) The obtained scaffolds sintered by different curve and their corresponding
morphology.
the grains. When the sintering temperature was too
high, most of the grains grew abnormally, leading to
excessive shrinkage of the scaffold. This shrinkage
exceeded that of the normally grown grains, which
severely deformed and even broke the scaffolds. In
view of this, 1100°C was set as the optimal sintering
temperature. This was also consistent with the findings
from other studies that 45S5 bioactive glass powder
above 1000°C must be sintered quickly and effectively
so that the particles grow densely to produce sufficient
mechanical strength [38,39] .
3.2. Components and structure of samples after
sintering
Components of sintered samples were analyzed by
XRD, as shown in Figure 4. 45S5 bioglass powder
was an amorphous structure (Figure 4: blue curve). Figure 4. XRD patterns of 45S5 bioglass powders (blue curve),
After sintering, organic components were completely 3D printed scaffold after sintering at 1100°C for 2 h (red curve).
decomposed, and some new peaks appeared as a result of The peaks of the Na Ca Si O phase and Na Ca (PO ) Si O phase
2
4
18
6
4 2
3
6
2
4
crystallization (Figure 4: red curve). One peak closely were marked by ● and ○, respectively.
matched the standard JCPDF card 77-2189, confirming that
the major crystalline phase was Na Ca Si O , while other of the two scaffolds had good integrity, and uniform
3
6
6
18
minor peaks which were the second phase represented pores were about 600 μm in diameter. Macropores
Na Ca (PO ) Si O , which matched the JCPDF card were interconnected with micropores, with the size of
4
2
4 2
4
2
32-1053. All these results were in accordance with the 5 – 10 μm. Rough surface structure may supply for
previous reports . the cell adhesion and proliferation, and interconnected
[40]
The sintering scaffold samples were observed using pores may supply for cell nutrient transportation and
SEM and the results are shown in Figure 5. The structure bone bioconductivity [41,42] . A low concentration of green
International Journal of Bioprinting (2022)–Volume 8, Issue 4 209