
Page 129 - IJB-9-1
P. 129
International Journal of Bioprinting Fabrication of 3D breast tumor model for drug screening
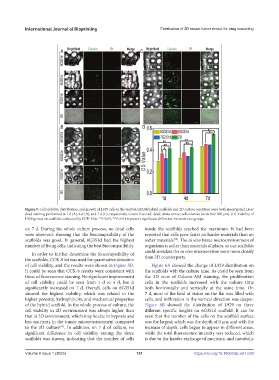
Figure 5. Cell viability, distribution, and growth of L929 cells in the Gel/SA/dECM hybrid scaffolds and 2D culture condition were both investigated. Live/
dead staining performed at 1 d (A), 4 d (B), and 7 d (C), respectively. Green: live; red: dead; white arrow: cell colonies (scale bar: 500 μm). (D) Viability of
L929 grown on scaffolds evaluated by CCK-8 kit. *P<0.05, **P<0.01 represent significant difference between two groups.
on 7 d. During the whole culture process, no dead cells inside the scaffolds reached the maximum. It had been
were observed, showing that the biocompatibility of the reported that cells grew faster on harder materials than on
[70]
scaffolds was good. In general, 6G3S1d had the highest softer materials . The in vivo tissue microenvironment of
number of living cells, indicating the best biocompatibility. organisms is softer than materials of plates, so our scaffolds
In order to further determine the biocompatibility of could simulate the in vivo microenvironment more closely
the scaffolds, CCK-8 kit was used for quantitative detection than 2D counterparts.
of cell viability, and the results were shown in Figure 5D. Figure 6A showed the change of L929 distribution on
It could be seen that CCK-8 results were consistent with the scaffolds with the culture time. As could be seen from
those of fluorescence staining. No significant improvement the 3D view of Calcein-AM staining, the proliferation
of cell viability could be seen from 1 d to 4 d, but it cells in the scaffolds increased with the culture time
significantly increased on 7 d. Overall, cells on 6G3S1d both horizontally and vertically at the same time. On
showed the highest viability, which was related to the 7 d, most of the field of vision on the flat was filled with
higher porosity, hydrophilicity, and mechanical properties cells, and infiltration in the vertical direction was deeper.
of the hybrid scaffold. In the whole process of culture, the Figure 6B showed the distribution of L929 on three
cell viability in 2D environment was always higher than different specific heights on 6G3S1d scaffold. It can be
that in 3D environment, which may be due to hypoxia and seen that the number of the cells on the scaffold surface
less nutrients in the tumor microenvironment compared was the largest, which was the depth of 0 μm, and with the
to the 2D culture . In addition, on 7 d of culture, no increase of depth, cells began to appear in different areas,
[69]
significant difference in cell viability among the three while the total fluorescence intensity was reduced, which
scaffolds was shown, indicating that the number of cells is due to the harder exchange of nutrients, and metabolic
Volume 9 Issue 1 (2023) 121 https://doi.org/10.18063/ijb.v9i1.630