
Page 131 - IJB-9-1
P. 131
International Journal of Bioprinting Fabrication of 3D breast tumor model for drug screening
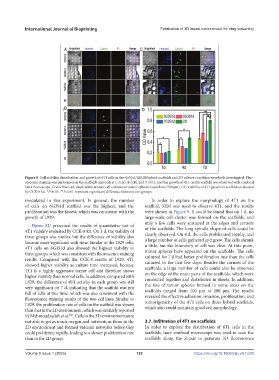
Figure 8. Cell viability, distribution, and growth of 4T1 cells in the Gel/SA/dECM hybrid scaffolds and 2D culture condition were both investigated. Fluo-
rescence staining was performed on the scaffolds and cells at 1 d (A), 4 d (B), and 7 d (C), and the growth of 4T1 on the scaffold was observed with confocal
laser microscope. Green: live; red: dead; white arrows: cell colonies or tumor spheres (scale bars: 500 μm). (D) Viability of 4T1 grown on scaffolds evaluated
by CCK-8 kit. *P<0.05, **P<0.01 represent significant difference between two groups.
inoculated in this experiment. In general, the number In order to explore the morphology of 4T1 on the
of cells on 6G3S1d scaffold was the highest, and the scaffold, SEM was used to observe 4T1, and the results
proliferation was the fastest, which was consistent with the were shown in Figure 9. It could be found that on 1 d, no
growth of L929. large-scale cell cluster was formed on the scaffolds, and
only a few cells were scattered at the edges and corners
Figure 8D presented the results of quantitative test of
4T1 viability evaluated by CCK-8 kit. On 1 d, the viability of of the scaffolds. The long spindle shape of cells could be
clearly observed. On 4 d, the cells proliferated rapidly, and
three groups was similar, but the difference of viability also a large number of cells gathered and grew. The cells shrank
became more significant with time. Similar to the L929 cells, a little, but the boundary of cell was clear. At this point,
4T1 cells on 6G3S1d also showed the highest viability in tumor spheres have appeared on the scaffolds. The cells
three groups, which was consistent with fluorescence staining cultured for 7 d had better proliferation rate than the cells
results. Compared with the CCK-8 results of L929, 4T1 cultured in the first few days. Besides the corners of the
showed higher viability as culture time increased, because scaffolds, a large number of cells could also be observed
4T1 is a highly aggressive tumor cell and therefore shows on the edge of the main parts of the scaffolds, which were
higher viability than normal cells. In addition, compared with connected together and distributed in sheets. In addition,
L929, the difference of 4T1 activity in each group was still the size of tumor spheres formed in some areas on the
very significant on 7 d, indicating that the scaffold was not scaffolds ranged from 100 μm to 200 μm. The results
full of cells at this time, which was also consistent with the revealed the effective adhesion, invasion, proliferation, and
fluorescence staining results of the two cell lines. Similar to tumorigenicity of the 4T1 cells on these hybrid scaffolds,
L929, the proliferation rate of cells on the scaffold was slower which also could maintain good cell morphology.
than that in the 2D environment, which was similarly reported
[69]
by Mahmoudzadeh et al. . Cells in the 3D environment were
not able to get as much oxygen and nutrients as those in the 3.7. Infiltration of 4T1 on scaffolds
2D environment and formed vascular networks before they In order to explore the distribution of 4T1 cells in the
could proliferate rapidly, leading to a slower proliferation rate scaffolds, laser confocal microscope was used to scan the
than in the 2D group. scaffolds along the Z-axis to generate 3D fluorescence
Volume 9 Issue 1 (2023) 123 https://doi.org/10.18063/ijb.v9i1.630