
Page 74 - IJB-9-1
P. 74
International Journal of Bioprinting Osteoconduction and scaffold directionality
Table 1. Characteristics of all scaffolds from the filament-based library
Microarchitecture Filaments in Rod dimension Macroporosity Transparency Surface of Surface of scaffold per mm
3
direction of bone and rod distance (%) (%) scaffold per mm 3 in direction of bone growth
growth (%) (mm) (mm ) (mm )
2
2
Fil040 100 0.40 50 25 1.87 1.25
FilG040 50 0.40 50 25 1.87 0.62
Fil050 100 0.50 50 25 1.50 1.00
FilG050 50 0.50 50 25 1.50 0.50
Fil083 100 0.83 50 25 0.90 0.59
FilG083 50 0.83 50 25 0.90 0.29
Fil125 100 1.25 50 25 0.60 0.40
FilG125 50 1.25 50 25 0.60 0.20
which were determined by the degree of defect bridging
(Figure 3B).
On average, bony bridging was 91.82 ± 10.84% for
Fil040 scaffolds, 84.39 ± 15.85% for Fil050 scaffolds, 92.13
± 16.65% for Fil083 scaffolds, and 78.64 ± 19.86% for
Fil125 scaffolds without any significant difference between
the four scaffold types (Figure 3B). Bony regenerated area
of Fil040 and Fil050 scaffolds was significantly larger than
that of Fil125 scaffolds. The average percentage of bony
regenerated area was 79.39 ± 16.43% for Fil040 scaffolds,
69.24 ± 20.27% for Fil050 scaffolds, 63.52 ± 20.99% for
Fil083 scaffolds, and 47.95 ± 15.96% for Fil125 scaffolds.
Overall, an increase in filament thickness and distance led
to a significant decrease in bony regenerated area.
3.3. Osteoconductivity of FilG-type scaffolds
The histologies of the middle sections (Figure 4A) from
FilG-type scaffolds with only 50% of the filaments being in
line with bone ingrowth direction into the defect revealed
that over 4 weeks of implantation, rod dimension and rod
distance affected osteoconductivity, determined by the
degree of defect bridging significantly (Figure 4B).
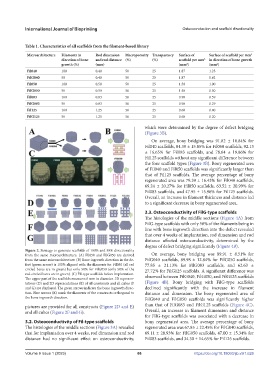
Figure 2. Strategy to generate scaffolds of 100% and 50% directionality
from the same microarchitecture. (A) Fil050 and FilG050 are derived On average, bony bridging was 89.91 ± 8.51% for
from the same microarchitecture. (B) Bone ingrowth direction in the de- FilG040 scaffolds, 89.98 ± 12.84% for FilG050 scaffolds,
fect (green arrow) is 100% aligned with the filaments for Fil050 (all red 77.85 ± 21.13% for FilG083 scaffolds, and 62.63 ±
circled bares are in green) but only 50% for FilG050 (only 50% of the 27.72% for FilG125 scaffolds. A significant difference was
red-circled bares are in green). (C) Fil-type scaffolds before implantation. observed between FilG040, FilG050, and FilG125 scaffolds
The upper part of the scaffolds measures 6 mm in diameter. 3D represen-
tations (D) and 2D representations (E) of all constructs and all cubes (F (Figure 4B). Bony bridging with FilG-type scaffolds
and G) are displayed. The green arrows indicate the bone ingrowth direc- declined significantly with the increase in filament
tion. Blue arrows (E) mark the filaments of the constructs orthogonal to distance and dimension. The bony regenerated area of
the bone ingrowth direction. FilG040 and FilG050 scaffolds was significantly higher
pictures are provided for all constructs (Figure 2D and E) than that of FilG083 and FilG125 scaffolds (Figure 4C).
and all cubes (Figure 2F and G). Overall, an increase in filament dimension and distance
for FilG-type scaffolds was associated with a decrease in
3.2. Osteoconductivity of Fil-type scaffolds bony regenerated area. The average percentage of bony
The histologies of the middle sections (Figure 3A) revealed regenerated area was 67.85 ± 22.45% for FilG040 scaffolds,
that for implantation over 4 weeks, rod dimension and rod 69.11 ± 28.93% for FilG050 scaffolds, 47.00 ± 15.34% for
distance had no significant effect on osteoconductivity, Fil083 scaffolds, and 34.30 ± 14.65% for Fil125 scaffolds.
V
Volume 9 Issue 1 (2023)olume 9 Issue 1 (2023) 66 https://doi.org/10.18063/ijb.v9i1.626