
Page 173 - IJB-9-2
P. 173
International Journal of Bioprinting 3D Printing Multifunctional Orthopedic Biocoatings
and PLGA-0.5%ACP-coated samples. The FTIR analysis obtained before and after applying the pressure sensitive
confirms the presence of PLGA polymer (C-H ~ 2997 cm , tape to the polymeric-coated samples depicted coatings
−1
−1
C=O ~ 1695 cm ) and ACP phase within the coatings. In that were undetached from the substrates. This indicates
addition, the ACP peaks (PO group ~ 1000 cm and 560 a strong adhesion between polymeric coatings and Ti
3−
−1
4
cm , CO group ~ 1640 cm ) are detected within the substrate. Figure 9 shows an optical image before and after
−1
2−
−1 [68]
3
blended PCL-ACP and PLGA-ACP coatings. adhesion test for PCL-coated samples.
3.4. Adhesion test As seen in the optical images after bond test, all the
coating was undetached after the removal of the pressure
The bonding strength and stability of the coatings were sensitive tape from the coated sample. A classification of
evaluated according to the American Society for Testing “5B” (0% area removed) was assigned as the adhesion test
[62]
Materials . ASTM-D3359-02 tape test was chosen to results for each sample fabricated. This indicated that the
study the adhesion of the various polymeric coatings on polymeric coatings strongly adhered on the surface of the
the substrates. A lattice pattern with 7 – 9 cuts in each Ti alloy substrate.
direction was made in the polymeric film to the substrate.
Pressure sensitive tape was then applied over the lattice 3.5. Cytocompatibility tests
and then peeled-off. Bond strength was evaluated by In vitro cell viability study results (Figure 10) indicate
comparison with descriptions and illustrations as stated that all the coated samples are cytocompatible, and no
[63]
by the ASTM D3359-02 procedure . Optical images significant differences were observed among the various
coated samples. These results also indicate that the nature
of the polymer and the amount of ACP present in the
composite films do not affect the cell viability.
3.6. In vitro cytocompatibility assessment
To confirm the cellular viability data, cell viability was
visualized by fluorescence imaging using live/dead staining.
Figure 11 shows the live/dead cells at 72 h (day 3) for the
different polymeric coatings and positive controls (bare
Ti). The PCL-ACP (sample codes: 1, 2, 5, and 6) coatings
showed cellular attachment that was comparable to the
positive controls. The number of layers for the PCL-ACP
coating does not appear to have much influence on the
cell attachment. This is also supported by the cell viability
results (Figure 10), which show comparable viability for the
10 and 20 layers of PCL-ACP films. However, the PLGA-
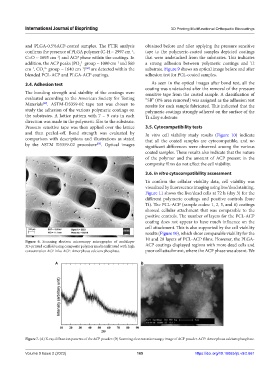
Figure 6. Scanning electron microscopy micrographs of multilayer
3D-printed scaffold using composite polymer media infiltrated with high ACP coatings displayed regions with more dead cells and
concentration ACP inks. ACP: Amorphous calcium phosphate. poor cell attachment, where the ACP phase was absent. We
A B
Figure 7. (A) X-ray diffraction patterns of the ACP powder. (B) Scanning electron microscopy image of ACP powder. ACP: Amorphous calcium phosphate.
Volume 9 Issue 2 (2023) 165 https://doi.org/10.18063/ijb.v9i2.661