
Page 176 - IJB-9-2
P. 176
International Journal of Bioprinting 3D Printing Multifunctional Orthopedic Biocoatings
A B
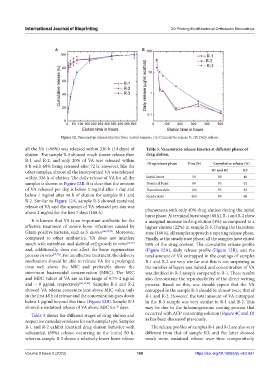
Figure 12. Vancomycin release kinetics from coated samples. (A) Cumulative release %. (B) Daily release.
all the VA (>98%) was released within 336 h (14 days) of Table 3. Vancomycin release kinetics at different phases of
elution. The sample R-3 showed much slower release than drug elution.
R-1 and R-2, and only 20% of VA was released within
8 h with 60% being released after 72 h. However, like the Drug release phase Time (h) Cumulative release (%)
other samples, almost all the incorporated VA was released R1 and R2 R3
within 336 h of elution. The daily release of VA for all the Initial burst 50 89 40
samples is shown in Figure 12B. It is clear that the amount Terminal burst 80 93 62
of VA released per day is below 2 mg/ml after 1 day and Transition state 160 95 92
below 1 mg/ml after 48 h of elution for samples R-1 and Steady state 400 98 98
R-2. Similar to Figure 12A, sample R-3 showed sustained
release of VA and the amount of VA released per day was
above 2 mg/ml for the first 7 days (168 h). phenomena with only 40% drug elution during the initial
burst phase. At terminal burst stage (80 h), R-1 and R-2 show
It is known that VA is an important antibiotic for the a marginal increase in drug elution (4%) as compared to a
effective treatment of severe bone infections caused by higher elution (22%) in sample R-3. During the transition
Gram-positive bacteria, such as S. aureus [66,73,74] . Moreover, state (160 h), all samples approach a tapering release phase.
compared to other antibiotics, VA does not interfere Finally, at the steady state phase, all the samples have eluted
much with osteoblast and skeletal cell growth in vitro [75,76] 98% of the drug content. The cumulative release profile
and, additionally, does not affect the bone regeneration (Figure 12A), daily release profile (Figure 12B), and the
process in vivo [77,78] . For an effective treatment, the delivery total amount of VA entrapped in the coatings of samples
mechanism should be able to release VA for a prolonged R-1 and R-2 are very similar and this is not surprising as
time well above the MIC and preferable above the the number of layers was halved, and concentration of VA
minimum bactericidal concentration (MBC). The MIC was doubled in R-2 sample compared to R-1. These results
and MBC values of VA are in the range of 0.75–2 µg/ml also demonstrate the reproducibility of the direct writing
and ~ 8 µg/ml, respectively [66,79,80] . Samples R-1 and R-2 process. Based on this, one should expect that the VA
showed VA release concentrations above MIC value only entrapped in the sample R-3 should be almost twice that of
in the first 48 h of release and the concentration goes down R-1 and R-2. However, the total amount of VA entrapped
below 1 µg/ml beyond this time (Figure 12B). Sample R-3 in the R-3 sample was very similar to R-1 and R-2. This
showed a sustained release of VA above MIC for 7 days. may be due to the inhomogeneous coating process that
Table 3 shows the different stages of drug elution and occurred with ACP containing solution (Figure 4C and D)
respective cumulative release for each sample type. Samples as has been discussed previously.
R-1 and R-2 exhibit identical drug elution behavior with The release profiles of samples R-1 and R-2 are also very
substantial (89%) release occurring in the initial 50 h, different from that of sample R3, and the latter showed
whereas sample R-3 shows a relatively lower burst release much more sustained release over time comparatively.
Volume 9 Issue 2 (2023) 168 https://doi.org/10.18063/ijb.v9i2.661