
Page 191 - IJB-9-2
P. 191
International Journal of Bioprinting A regulated GelMA-MSCs scaffold by three-dimensional bioprinting
ten passages, the cells still maintained the same fusiform days 7 and 14 after induced differentiation (ns, P > 0.05),
fibrous cell morphology as the third passage cells, and a but was about 3 times higher than that of undifferentiated
large number of cells grew in spiral-like aggregates (Figure cells on day 21 (***, P < 0.001). Combined with the above
S2A). The positive rates of cell surface antigens CD34, results, it can be seen that the osteogenic and chondrogenic
CD44, and CD45 were detected by flow cytometry. The differentiation of rabbit MSCs were successful, and the
expression rate of CD34, CD45 and CD44 was 3.4%, 7.2% satisfactory differentiation effect was achieved on the
and 98.2%, respectively (Figure S2B). After 21 days of 21 day.
st
osteogenic differentiation, stained by Alizarin red, it was
found that the osteogenic induced cells were orange and 3.4. Cytocompatibility study of GelMA-MSCs
aggregated into calcium nodules, indicating that the rabbit scaffold
MSCs had osteogenic differentiation ability. After 21 days To evaluate the biocompatibility of GelMA 3D cultured
of chondrogenic differentiation of rabbit MSCs, we found rabbit MSCs, the cell proliferation was first detected by
blue staining after the acidic mucosaccharide staining of CCK-8 method. It was found that on days 1, 3, and 5,
cartilage, indicating the ability of MSCs to differentiate there was no statistically significant difference between the
into cartilage. After 21 days of adipogenic differentiation, normal adherent group and the gelatin group. Under 3D
Oil Red O staining showed that the neutral fat stained environment, optical density (OD) value of the bonding
orange-red, indicating that the rabbit MSCs had the ability group was gradually higher than that of the GelMA culture
to differentiate into adipocytes (Figure S2C). group, especially on day 5, OD value difference between the
normal adherent group and the GelMA-60 5% group was the
3.3. Expression of specific genes related to largest (**, P<0.01), and on the 7 day, the OD value of the
th
osteogenesis and chondrogenesis 3D culture group was close to that of the normal adherent
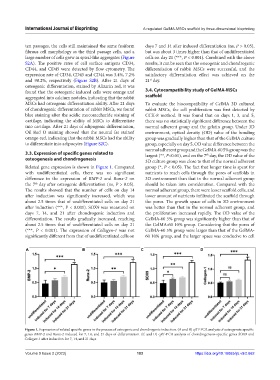
Related gene expression is shown in Figure 1. Compared group (*, P < 0.05). The fact that longer time is spent for
with undifferentiated cells, there was no significant nutrients to reach cells through the pores of scaffolds in
difference in the expression of BMP-2 and Runx-2 on 3D environment than that in the normal adherent group
the 7 day after osteogenic differentiation (ns, P > 0.05). should be taken into consideration. Compared with the
th
The results showed that the number of cells on day 14 normal adherent group, there were lesser scaffold cells, and
after induction was significantly increased, which was lower amount of nutrients infiltrated the scaffold through
about 2.5 times that of undifferentiated cells on day 21 the pores. The growth space of cells in 3D environment
after induction (***, P < 0.001). SOX9 was measured on was better than that in the normal adherent group, and
days 7, 14, and 21 after chondrogenic induction and the proliferation increased rapidly. The OD value of the
differentiation. The results gradually increased, reaching GelMA-60 5% group was significantly higher than that of
about 2.5 times that of undifferentiated cells on day 21 the GelMA-60 10% group. Considering that the pores of
(***, P < 0.001). The expression of Collagen-1 was not GelMA-60 5% group were larger than that of the GelMA-
significantly different from that of undifferentiated cells on 60 10% group, and the larger space was conducive to cell
A B C D
Figure 1. Expression of related specific genes in the process of osteogenic and chondrogenic induction. (A and B) qRT-PCR analysis of osteogensis-specific
genes BMP-2 and Runx-2 induced for 7, 14, and 21 days of differentiation. (C and D) qRT-PCR analysis of chondrogenesis-specific genes SOX9 and
Collagen-1 after induction for 7, 14, and 21 days.
Volume 9 Issue 2 (2023) 183 https://doi.org/10.18063/ijb.v9i2.662