
Page 434 - IJB-9-2
P. 434
International Journal of Bioprinting Shear-thinning and bioprinting parameters
alginate (Table 2). Thus, the lower the alginate percentage, First, an adaptive mesh was set up to achieve a
the closer the behavior index approaching unity – behavior balance between good model resolution and acceptable
typical of a Newtonian fluid. This is attributable to the computational load to differentiate the volumetric fraction
properties and influence of the proportion of water present of the hydrogel from that of the air. The simulation time
in the samples. The density of the hydrogels also increased was in the range of 6 – 10 h.
slightly with increasing percentage of alginate. It was found that for low pressures (around 200 kPa), the
3.2. Computer simulation sample created a droplet at the nozzle outlet that ended up
falling off. For high pressures, however (around 5000 kPa),
The objective was to relate the rheological data that a uniform flow was created to end by being deposited onto
characterize the hydrogels with those simulation the simulated bioprinting bed. To be able to compare the
parameters that have a possible relationship with those pressures at which the hydrogels exhibited this behavior,
programmed in the bioprinter. To this end, it was necessary the droplet detachment limit was sought.
to create a model of the bioprinter using the COMSOL
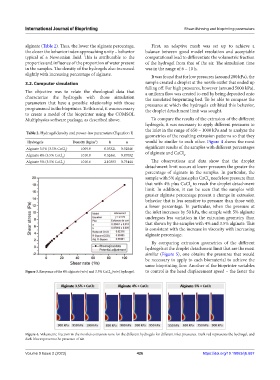
Multiphysics software package, as described above. To compare the results of the extrusion of the different
hydrogels, it was necessary to apply different pressures to
the inlet in the range of 650 – 1000 kPa and to analyze the
Table 2. Hydrogel density and power-law parameters (Equation I)
geometries of the resulting extrusion patterns so that they
Hydrogels Density (kg/m ) k n would be similar to each other. Figure 4 shows the most
3
Alginate 3.5% (3.5% CaCl ) 1009.9 0.05321 0.92846 significant results of the samples with different percentages
2
Alginate 4% (3.5% CaCl ) 1010.8 0.32461 0.87092 of alginate and CaCl .
2
2
Alginate 5% (3.5% CaCl ) 1016.6 2.10303 0.75444 The observations and data show that the droplet
2
detachment limit occurs at lower pressures the greater the
percentage of alginate in the samples. In particular, the
sample with 5% alginate plus CaCl needs less pressure than
2
that with 4% plus CaCl to reach the droplet detachment
2
limit. In addition, it can be seen that the samples with
greater alginate percentage present a change in extrusion
behavior that is less sensitive to pressure than those with
a lower percentage. In particular, when the pressure at
the inlet increases by 50 kPa, the sample with 5% alginate
undergoes less variation in the extrusion geometry than
that shown by the samples with 4% and 3.5% alginate. This
is consistent with the increase in viscosity with increasing
alginate percentage.
By comparing extrusion geometries of the different
hydrogels at the droplet detachment limit that are the most
similar (Figure 5), one obtains the pressures that would
be necessary to apply to each biomaterial to achieve the
same bioprinting flow. Another of the bioprinter variables
Figure 3. Response of the 4% alginate (w/v) and 3.5% CaCl (w/v) hydrogel. to control is the head displacement speed – the faster the
2
Figure 4. Volumetric fraction in the nozzle’s extrusion zone for the different hydrogels for different inlet pressures. Dark red represents the hydrogel, and
dark blue represents the presence of air.
Volume 9 Issue 2 (2023) 426 https://doi.org/10.18063/ijb.687