
Page 436 - IJB-9-2
P. 436
International Journal of Bioprinting Shear-thinning and bioprinting parameters
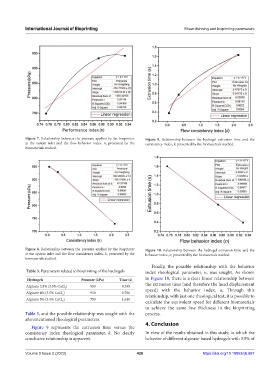
Figure 7. Relationship between the pressure applied by the bioprinter Figure 9. Relationship between the hydrogel extrusion time and the
at the system inlet and the flow behavior index, n, presented by the consistency index, k, presented by the biomaterials studied.
biomaterials studied.
Figure 8. Relationship between the pressure applied by the bioprinter Figure 10. Relationship between the hydrogel extrusion time and the
at the system inlet and the flow consistency index, k, presented by the behavior index, n, presented by the biomaterials studied.
biomaterials studied.
Finally, the possible relationship with the behavior
Table 3. Parameters related to bioprinting of the hydrogels index rheological parameter, n, was sought. As shown
Hydrogels Pressure (kPa) Time (s) in Figure 10, there is a clear linear relationship between
Alginate 3.5% (3.5% CaCl ) 950 0.395 the extrusion time (and therefore the head displacement
2 speed) with the behavior index, n. Through this
Alginate 4% (3.5% CaCl ) 930 0.780 relationship, with just one rheological test, it is possible to
2
Alginate 5% (3.5% CaCl ) 750 1.610 calculate the equivalent speed for different biomaterials
2
to achieve the same line thickness in the bioprinting
Table 3, and the possible relationship was sought with the process.
aforementioned rheological parameters.
Figure 9 represents the extrusion time versus the 4. Conclusion
consistency index rheological parameter, k. No clearly In view of the results obtained in this study, in which the
conclusive relationship is apparent. behavior of different alginate-based hydrogels with 3.5% of
Volume 9 Issue 2 (2023) 428 https://doi.org/10.18063/ijb.687