
Page 199 - IJB-9-3
P. 199
International Journal of Bioprinting 3D-printed vascularized biofunctional scaffold
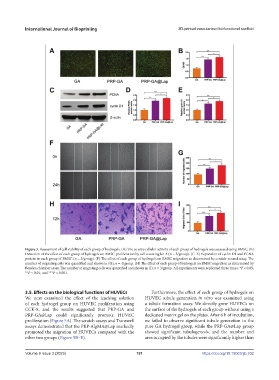
Figure 3. Assessment of cell viability of each group of hydrogels. (A) The in vitro cellular activity of each group of hydrogels was assessed using BMSC. (B)
Detection of the effect of each group of hydrogels on BMSC proliferation by cell counting kit-8 (n = 3/group). (C–E) Expression of cyclin D1 and PCNA
protein in each group of BMSC (n = 3/group). (F) The effect of each group of hydrogels on BMSC migration as determined by scratch-wound assay. The
number of migrating cells was quantified and shown in (G); n = 4/group. (H) The effect of each group of hydrogels on BMSC migration as determined by
Boyden chamber assay. The number of migrating cells was quantified and shown in (I); n = 3/group. All experiments were replicated three times. *P < 0.05,
**P < 0.01, and ***P < 0.001.
3.5. Effects on the biological functions of HUVECs Furthermore, the effect of each group of hydrogels on
We next examined the effect of the leaching solution HUVEC tubule generation in vitro was examined using
of each hydrogel group on HUVEC proliferation using a tubule formation assay. We directly grew HUVECs on
CCK-8, and the results suggested that PRP-GA and the surface of the hydrogels of each group without using a
PRP-GA@Lap could significantly promote HUVEC dedicated matrix gel on the plates. After 6 h of incubation,
proliferation (Figure 5A). The scratch assays and Transwell we failed to observe significant tubule generation in the
assays demonstrated that the PRP-AlgMA@Lap markedly pure GA hydrogel group, while the PRP-GA@Lap group
promoted the migration of HUVECs compared with the showed significant tubulogenesis, and the number and
other two groups (Figure 5B–E). area occupied by the tubules were significantly higher than
Volume 9 Issue 3 (2023) 191 https://doi.org/10.18063/ijb.702