
Page 393 - IJB-9-3
P. 393
International Journal of Bioprinting Bioprinting of a multicellular model
A B C
D E F
G H I
J K L
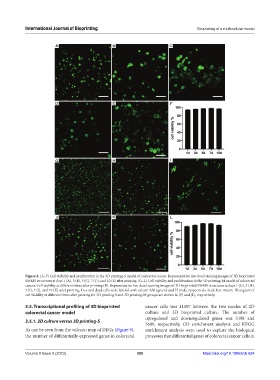
Figure 4. (A–F) Cell viability and proliferation in the 3D printing-S model of colorectal cancer. Representative live-dead staining images of 3D bioprinted
SW480 structures at days 1 (A), 3 (B), 5 (C), 7 (D), and 10 (E) after printing. (G–L) Cell viability and proliferation in the 3D printing-M model of colorectal
cancer. Cell viability at different times after printing (B). Representative live-dead staining images of 3D bioprinted SW480 structures at days 1 (G), 3 (H),
5 (I), 7 (J), and 10 (K) after printing. Live and dead cells were labeled with calcein AM (green) and PI (red), respectively. Scale bar: 40 µm. Histogram of
cell viability at different times after printing for 3D printing S and 3D printing-M groups are shown in (F) and (L), respectively.
3.5. Transcriptional profiling of 3D bioprinted cancer cells was 11107 between the two modes of 2D
colorectal cancer model culture and 3D bioprinted culture. The number of
upregulated and downregulated genes was 5498 and
3.5.1. 2D culture versus 3D printing-S
5609, respectively. GO enrichment analysis and KEGG
As can be seen from the volcano map of DEGs (Figure 9), enrichment analysis were used to explore the biological
the number of differentially expressed genes in colorectal processes that differential genes of colorectal cancer cells in
Volume 9 Issue 3 (2023) 385 https://doi.org/10.18063/ijb.694