
Page 394 - IJB-9-3
P. 394
International Journal of Bioprinting Bioprinting of a multicellular model
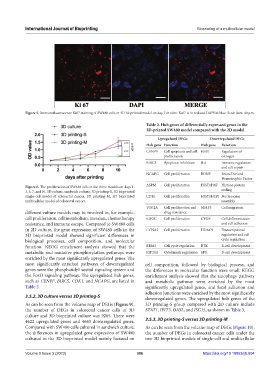
Figure 5. Immunofluorescence Ki67 staining of SW480 cells in 3D bioprinted model on day 7 in vitro. Ki67 is in red and DAPI in blue. Scale bars: 40 µm.
Table 2. Hub genes of differentially expressed genes in the
3D-printed SW480 model compared with the 2D model
Upregulated DEGs Downregulated DEGs
Hub gene Function Hub gene Function
CENPF Cell apoptosis and cell ESR1 Regulation of
proliferation estrogen
BIRC5 Apoptosis inhibition IL4 Immune regulation
and cell repair
NCAPG Cell proliferation BDNF Brain-Derived
Neurotrophic Factor
Figure 6. The proliferation of SW480 cells in the three models on days 1, ASPM Cell proliferation HIST1H4F Histone protein
3, 5, 7, and 10. 3D culture, sandwich culture; 3D printing-S, 3D bioprinted coding
single-cell model of colorectal cancer; 3D printing-M, 3D bioprinted CDK1 Cell proliferation HIST1H2BJ Nucleosome
multicellular model of colorectal cancer. assembly
TOP2A Cell proliferation and MMP3 Cell migration
different culture models may be involved in, for example, drug resistance
cell proliferation, cell metabolism, invasion, chemotherapy KIF2C Cell proliferation CTGF Cell differentiation
resistance, and immune escape. Compared to SW480 cells and cell adhesion
in 2D culture, the gene expression of SW480 cells in the CCNA2 Cell proliferation HDAC9 Transcriptional
3D bioprinted model showed significant differences in regulation and cell
biological processes, cell composition, and molecular cycle regulation
function. KEGG enrichment analysis showed that the RRM2 Cell cycle regulation BTK B-cell development
metabolic and oxidative phosphorylation pathways were KIF20A Cytokinesis regulation SPI1 B-cell development
enriched by the most significantly upregulated genes. The
most significantly enriched pathways of downregulated cell composition, followed by biological process, and
genes were the phosphatidylinositol signaling system and the differences in molecular function were small. KEGG
the FoxO signaling pathway. The upregulated hub genes, enrichment analysis showed that the autophagy pathway
such as CENPF, BIRC5, CDK1, and NCAPG, are listed in and metabolic pathway were enriched by the most
Table 2. significantly upregulated genes, and focal adhesion and
adhesion junctions were enriched by the most significantly
3.5.2. 3D culture versus 3D printing-S downregulated genes. The upregulated hub genes of the
As can be seen from the volcano map of DEGs (Figure 9), 3D printing-S group compared with 2D culture include
the number of DEGs in colorectal cancer cells of 3D STAT1, IFIT3, OASL, and ISG15, as shown in Table 3.
culture and 3D bioprinted culture was 9265. There were
4622 upregulated genes and 4643 downregulated genes. 3.5.3. 3D printing-S versus 3D printing-M
Compared with SW480 cells cultured in sandwich culture, As can be seen from the volcano map of DEGs (Figure 10),
the differences in upregulated gene expression of SW480 the number of DEGs in colorectal cancer cells under the
cultured in the 3D bioprinted model mainly focused on two 3D bioprinted models of single-cell and multicellular
Volume 9 Issue 3 (2023) 386 https://doi.org/10.18063/ijb.694