
Page 399 - IJB-9-3
P. 399
International Journal of Bioprinting Bioprinting of a multicellular model
A B
C D
E
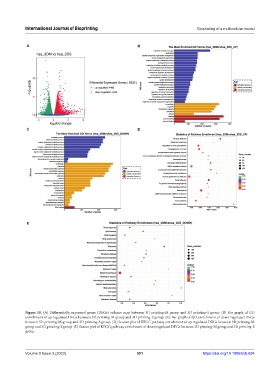
Figure 10. (A) Differentially expressed genes (DEGs) volcano map between 3D printing-M group and 3D printing-S group. (B) Bar graph of GO
enrichment of up regulated DEGs between 3D printing-M group and 3D printing-S group. (C) Bar graph of GO enrichment of down regulated DEGs
between 3D printing-M group and 3D printing-S group. (D) Scatter plot of KEGG pathway enrichment of up regulated DEGs between 3D printing-M
group and 3D printing-S group. (E) Scatter plot of KEGG pathway enrichment of down regulated DEGs between 3D printing-M group and 3D printing-S
group.
Volume 9 Issue 3 (2023) 391 https://doi.org/10.18063/ijb.694