
Page 396 - IJB-9-3
P. 396
International Journal of Bioprinting Bioprinting of a multicellular model
A B pathway and EGFR receptor tyrosine inhibitor resistance
pathway kinase inhibitor resistance, and significant
enrichment of downregulated genes was associated with
metabolic pathways and ribosome pathways. Upregulated
hub genes between the 3D printing-S group and 2D culture
include ITGAM, IL1B, FCGR2A, and CYBB, as shown in
Table 4 and Figure 11.
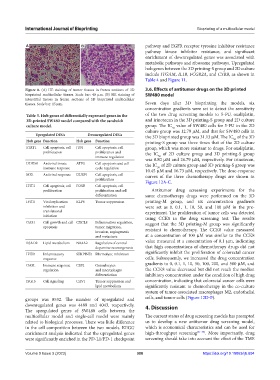
Figure 8. (A) HE staining of tumor tissues in frozen sections of 3D 3.6. Effects of antitumor drugs on the 3D printed
bioprinted multicellular tissues. Scale bar: 40 µm. (B) HE staining of SW480 model
interstitial tissues in frozen sections of 3D bioprinted multicellular
tissues. Scale bar: 15 µm. Seven days after 3D bioprinting the models, six
concentration gradients were set to detect the sensitivity
Table 3. Hub genes of differentially expressed genes in the of the two drug screening models to 5-FU, oxaliplatin,
3D-printed SW480 model compared with the sandwich and irinotecan in the 3D printing-S group and 2D culture
culture model. group. The IC value of SW480 cells for 5-FU in the 2D
50
culture group was 12.79 µM, and that for SW480 cells in
Upregulated DEGs Downregulated DEGs the 3D bioprinted group was 31.13 µM. The IC of the 3D
50
Hub gene Function Hub gene Function printing-S group was three times that of the 2D culture
STAT1 Cell apoptosis, cell JUN Cell apoptosis, cell group, which was more resistant to drugs. For oxaliplatin,
proliferation proliferation and the IC of 2D culture group and 3D printing-S group
50
immune regulation was 0.80 µM and 26.79 µM, respectively. For irinotecan,
DDX58 Antiviral innate ATF3 Cell apoptosis and cell the IC of 2D culture group and 3D printing-S group was
immune response cycle regulation 10.45 µM and 16.73 µM, respectively. The dose-response
50
MX1 Antiviral response DUSP1 Cell apoptosis, cell curves of the three chemotherapy drugs are shown in
proliferation Figure 12A-C.
IFIT3 Cell apoptosis, cell FOSB Cell apoptosis, cell
proliferation proliferation and cell Antitumor drug screening experiments for the
differentiation same chemotherapy drugs were performed on the 3D
IFIT1 Viral replication KLF6 Tumor suppression printing-M group, and six concentration gradients
inhibition and were set as 0, 0.1, 1, 10, 50, and 100 µM in the pre-
translational experiment. The proliferation of tumor cells was detected
initiation
using CCK8 in the drug screening test. The results
OAS1 Cell growth and cell CXCL8 Inflammation regulation, suggest that the 3D printing-M group was significantly
apoptosis tumor migration, resistant to chemotherapy. The CCK8 value measured
invasion, angiogenesis
and metastasis at a concentration of 100 µM was similar to the CCK8
value measured at a concentration of 0.1 µm, indicating
RSAD2 Lipid metabolism NR4A2 Regulation of central
dopamine neurongenesis that high concentrations of chemotherapy drugs did not
IFIH1 Inflammatory SERPINE1 Fibrinolytic inhibition significantly inhibit the proliferation of colorectal cancer
response cells. Subsequently, we increased the drug concentration
OASL Immune response CSF2 Granulocytes gradients to 0, 0.1, 1, 10, 50, 100, 200, and 500 µM, and
regulation and macrophages the CCK8 value decreased but did not reach the median
differentiation inhibitory concentration under the condition of high drug
ISG15 Cell signaling CAV1 Tumor suppression and concentration, indicating that colorectal cancer cells were
lipid metabolism significantly resistant to chemotherapy in the co-culture
system of tumor-associated macrophages M2, endothelial
groups was 8532. The number of upregulated and cells, and tumor cells (Figure 12D-F).
downregulated genes was 4489 and 4043, respectively. 4. Discussion
The upregulated genes of SW480 cells between the
multicellular model and single-cell model were mainly The current status of drug screening models has prompted
related to biological processes. There was little difference us to develop a new antitumor drug screening model,
in the cell composition between the two models. KEGG which is economical characteristics and can be used for
enrichment analysis indicated that the upregulated genes high-throughput screening [31-33] . More importantly, drug
were significantly enriched in the PD-L1/PD-1 checkpoint screening should take into account the effect of the TME
Volume 9 Issue 3 (2023) 388 https://doi.org/10.18063/ijb.694