
Page 397 - IJB-9-3
P. 397
International Journal of Bioprinting Bioprinting of a multicellular model
A B
C D
E F
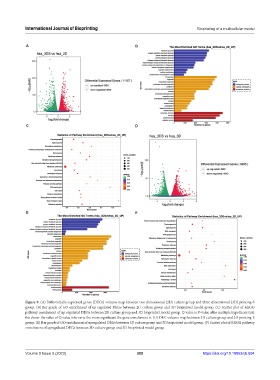
Figure 9. (A) Differentially expressed genes (DEGs) volcano map between two dimensional (2D) culture group and three dimensional (3D) printing-S
group. (B) Bar graph of GO enrichment of up regulated DEGs between 2D culture group and 3D bioprinted model group. (C) Scatter plot of KEGG
pathway enrichment of up regulated DEGs between 2D culture group and 3D bioprinted model group. Q value is P-value after multiple hypothesis test;
the closer the value of Q value is to zero, the more significant the gene enrichment is. (D) DEG volcano map between 3D culture group and 3D printing-S
group. (E) Bar graph of GO enrichment of upregulated DEGs between 3D culture group and 3D bioprinted model group. (F) Scatter plot of KEGG pathway
enrichment of upregulated DEGs between 3D culture group and 3D bioprinted model group.
Volume 9 Issue 3 (2023) 389 https://doi.org/10.18063/ijb.694